
Learner Analytics And Reporting Vs Traditional Report Cards - Now 5 People For Every Learner Need Reports (and Analytics)
Nowhere in the history of education has anyone seen such an exciting live experiment that online learning provides today. It allows those who actively support learners to see instant relevant actionable data which maximizes the chances of a learner’s success. With so many of the learner’s supporters having instant access to their respective learner’s performance, there is an enormous role reversal in the relevance of a traditional learner academic report card. Most educators would agree that online education is changing today’s learning landscape, but many may not know or see how hidden data viewed through analytics and reports is transforming education into a live performance that can be seen by 5 or more stakeholders simultaneously.
So, who are these 5 stakeholders? To answer this, let’s do a quick review of how the radical idea of “free” allowed “instant” to happen.
Thanks to “free” Learning Management Systems with integrated Intelliboard analytics and reports such as Moodle, “instant” learner analytics and reporting became possible and thus making traditional learner report cards and their value dead and useless. What good are old fashioned report cards when the cycle of learning new concepts, testing a learner’s knowledge on these concepts, and repeating has been shortened to the amount of time it takes for a learner to finish an online activity or course exam? Being along for the academic journey with the learner and seeing how the learner arrived at a particular score has become a far more important story than a periodic score or worse yet a single score at the end of a course. Now stakeholders, with properly validated permissions, can get access to these relevant details in order to intelligently support their learners in a way like never before. The history and actions of learners are now being evaluated in real-time and the resulting charts and graphs show learning patterns and study habits in graphic detail that is easily understood by those who want their learners to succeed.
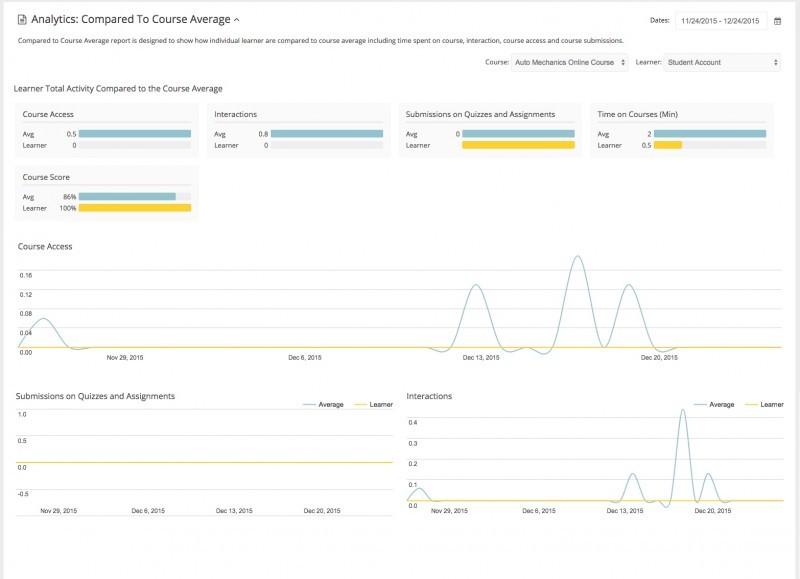
Graph 1: Live analytics sample from IntelliBoard.net
Yes, teachers and parents are still the two main influences in a learner’s life who are actively participating in their learner’s education, but now three other influences are increasing their stake in a learner’s success. Online school administrators, employers, and eLearning content providers are now able to proactively influence the outcome of this live education experiment in order to improve their learner’s chances of success. Administrators can quickly see problems in any learner’s education habits with notifications. Employers can see easily access grades to determine good candidates or view academic scores if they have a hand in paying for courses. eLearning content providers can at the behest of academic decision makers adjust live learning content to improve academic proficiency. Never in the history of education has the learner ever had the opportunity to be so well supported nor has there ever been the opportunity for educators see where and how to improve education resources in real time and be able to immediately act to make course improvements. This is all entirely possible because of real-time learner analytics and reporting tools available now; today!
A limited few companies have created analytics for Moodle in an attempt to interpret learner data stored inside, but a company called Intelliboard, Inc. has taken it one step further. By adding the ability to aggregate data from third party plugins and multiple simultaneous servers, Intelliboard, Inc. does indeed provide educators with the ability to see not only individual learner reports, but show historical and live learner data trends of how a learners arrived to their academic scores. It gets even better though. Not only can all the hidden aggregated Moodle and third party data be seen through charts, graphs, and unlimited reports by school administrators, but as described previously, employers, parents, and eLearning content providers can, with proper administrator permissions, easily “surf” their respective data.
The ability for eLearning content providers to see their learner’s academic growth in real-time allows the evolution cycle of education to speed up in way that has never been done before live analytics. eContent providers who use IntelliBoard.net to track learner academic progress metrics can help adapt their content on-the-fly to meet a school’s academic goals much faster by adding more or less support for certain courses. Teachers, parents, and employers are using IntelliBoard.net’s real-time data analysis and reports to make well informed decisions on how to best support their respective learners.
IntelliBoard.net focuses on telling the story about learners individually or as a group through a robust dashboard that is currently available when you set up an account through their website. Below you can see the IntelliBoard.net dashboard inside of Moodle and outside of Moodle.
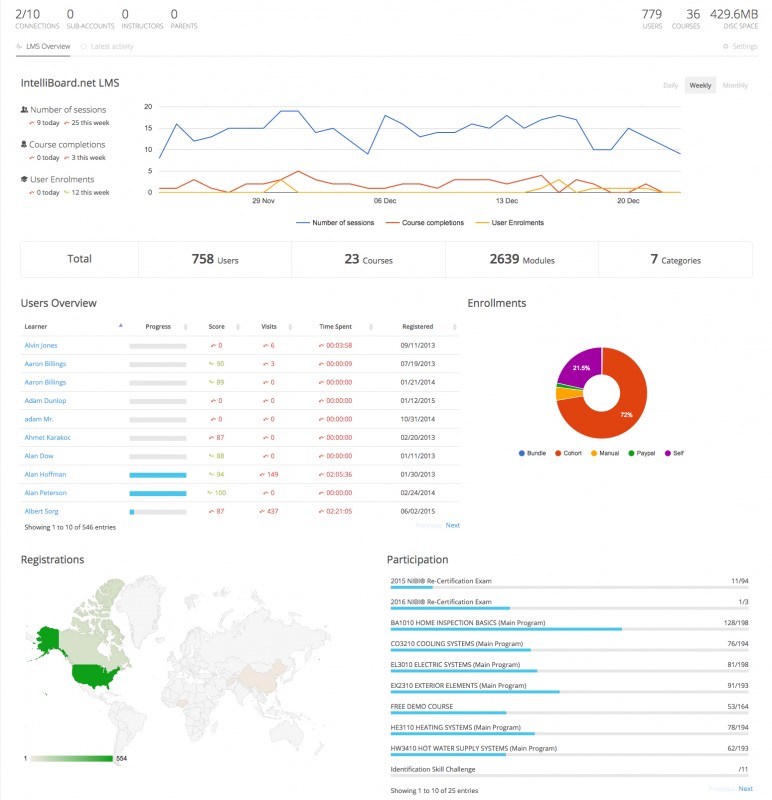
Graph 2: Intelliboard.net's dashboard home screenshot with live on-demand sample data
From an administrator’s point of view, Intelliboard, Inc. offers unparalleled access to all your hidden data by offering all available analytics and reports. Interestingly, once a user has an account set up, some of the data can be seen directly inside of Moodle itself but most data viewing magic happens when using the robust external dashboard. Here is where you can see how the integrated software has the ability to pull and show data graphically. The simple graph below shows an often hard truth that some schools do not want to face but allows them to make a very quick and intelligent decision about how well their Moodle server is serving their learners. While trying to decide on the whether or not to continue hosting their own Moodle server, upgrade their current local server or upgrade to a much more powerful off site hosted Moodle server, this graph can easily help school administrators see correlations between when the Moodle server is the most stressed and if they match peak periods when access issues begin to arise. Wondering what to do here is no longer trial and error, school administrators can clearly see if their Moodle is getting stressed and when which allows them to make informed decision on any necessary upgrades quickly.
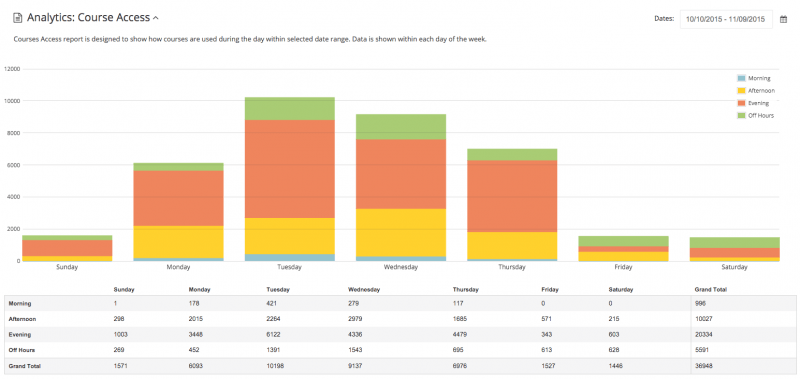
Graph 3: IntelliBoard.net's analytic sample data showing the number of people who accessed courses in a specific date range
If you are skeptical about whether or not IntelliBoard.net could work for you, it’s free to try and the IntelliBoard team will even build additional reports for you at no charge if you are an annual enterprise subscriber. This user friendly offer certainly takes the questions out of whether or not IntelliBoard will only work with part of your Moodle or if you have a heavily customized Moodle platform. Understanding the world around you is what education addresses and now learner analytics and reports are amazing tools which quickly and effortlessly educates the educators. The now useless and defunct academic report card has been effectively replaced by a much more powerful metric tool that puts the evolution of education literally at your fingertips.
