
The Importance Of Learning Analytics In Digital Design
Let’s take a look at some global stats from Elucidat: When we uncover the data trails left by Elucidat’s 3 million users across the globe, we find some interesting stats. For example, the global average session time for accessing eLearning content is 15 minutes. However, this increases to 30 minutes for the USA and Germany. Who’d have guessed? That’s some serious learning dedication going on – or, hopefully, some really great designs that are keeping users hooked for longer. Diving in to find out what approaches are keeping users hooked tells a tale for future designs.
Hottest Usage Times
Across the globe, lunchtimes are the peak time for eLearning usage. Sandwiches with a side of digital learning makes for a great meal combo. But there’s a bigger window on Mondays and Tuesdays, with people accessing their digital learning between 10am and 2pm on these days. So, if you were thinking of launching a brand new piece of content, it’s probably a good bet to publish it around those times.
For those accessing digital learning on their mobiles, we uncovered that 9pm is the most popular time. Who’d have guessed that this creeps up to 10pm in the UK? Digital learning as bedtime reading is a scary thought, but the point we’re making is that analyzing data opens up a lot of fascinating insights you couldn’t have guessed.

Digital Body Language
A feature of traditional classroom learning—where the student and the trainer are in the same environment at the same time—is that the trainer can take cues from the audience to see whether they are engaged or not. The students will give the trainer signals, both consciously and subconsciously. If the trainer notices that the learners are disengaged, they can adapt their approach to try and increase engagement.
The amazing thing is that these clues are still very much present in the digital environment. Look for drop-offs in learners, a reduction in clicks, or fewer likes and shares. These are all indications of low engagement, simply in the digital format.
Reading data is like reading the digital body language of your audience.
Is Getting Learners’ Attention The Be All And End All?
No, but in the digital age, a learner is bombarded with a wealth of information that is constantly fighting for their attention. This includes instant messages, tasks, email pop-ups, alerts, and notifications. Combined with the fact that the average person will turn to Google as their #1 option to find a solution to a problem, your content has to stand out from the crowd. Engaging audiences is a major hurdle. If your content doesn’t connect and engage with individuals, it’s unlikely to be talked about and is highly unlikely to drive change.
On the flip side, reading digital body language, listening to feedback, and taking a more performance consulting-based approach increase the chances of your content making an impact.
We’re Talking Data-Driven Learning Design
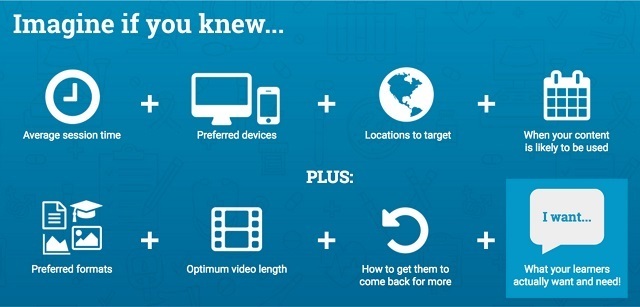
Imagine if before you began designing a brand new digital learning experience, you knew the formats your audience preferred and the optimum video length for expert videos – or how about a proven method that gets learners to hop from one topic to another and choose to extend their overall session time?
Data put strategies in your pocket you might not otherwise have. It enables you to put away the crystal ball and invest in ideas that have a greater chance of paying off. That doesn’t mean you stop being creative – quite the opposite. Instead, you can channel your creative designs to solve the problems and opportunities that data throws up, stick with trends that are working, and then use data to tweak and refine to get the very best results while your project is live.
If you want to know more about how to use data to decode the digital body language of your audience and design eLearning that really works, download The Everyday Guide To Learning Analytics. It's free!
Related articles:
1. How To Conduct Learning Data Analysis To Draw Meaningful Insights
