


Can I Have A Dashboard That Explains Itself?
As learning professionals, our ultimate goal is not to build engaging learning experiences at the workplace. We do this to enable the workforce to have the knowledge and skills to do their job well. Often, this requires behavior change. How do we know if we're doing the right thing? How do we know if what we provide is effective?
Business Problem
We measure and evaluate our programs. Measurement produces data. Sometimes lots of data. But data itself is not enough to show what works and what doesn't. We need to be able to read, write, interpret, and argue with data effectively to provide actionable insights for stakeholders. These stakeholders can be the learning team themselves, the business, or the workforce.
What's the first thing we do with data? Build dashboards. Unfortunately, starting with visualizing data on random dashboards that take a lot of effort to maintain may not be the best starting point. I've seen a multitude of dashboards built without a single decision then being made based on "insights" from them. Then, what's the point?
What Should Come Before Dashboards?
Data literacy. Once you have the fundamental skills to read, write, understand, analyze, and argue with data, you will build more effective dashboards. To help learning professionals build their fundamental data literacy skills, I've built a data literacy ("game") experience. I've taken this hands-on experience to multiple national and international conferences. The "gameboard" is actually a dashboard. It comes with data cards that teams need to read, understand, analyze, and argue about. The concept worked well in an in-person setting with teams arguing about data around tables.
What I needed for a virtual version was an assistant. An intelligent character that participants can ask not only about general data literacy and statistics but also specifics about the dashboard and those cards. 2023 was the year of Artificial Intelligence (AI), specifically, generative AI. So, naturally, I turned to several AI options to solve this problem.
Of course, ChatGPT was an obvious candidate as it could spew out generic answers to questions. But when it came to specifics for pilot data, especially for a dashboard that does not exist anywhere, it didn't work well. The ability to create custom GPTs opened up new possibilities, with the limitation that participants also need to have paid access.
Another option I played with was Poe. Not Edgar, he's dead: spooky but not practical. I used the helpful chat. It allows us to build an app with preset information, and specifics for the conversation. But it was still far from what I needed to really support the data literacy program. After finding a myriad of AI solutions, I realized I made the same mistake I often warn others about: "don't start with the solution and find a problem to solve for. Start with the well-defined problem and find the best solution." So, I went back to the mental drawing board.
A Whole World, Not Just A Chat
After reflecting on the success of the in-person experience with humans around the table, I started looking at data and the dashboard differently: as a system. Humans brought this dashboard alive by speaking (or, at least, trying to) the language of data. They were explaining the dashboard to each other. They disagreed, questioned each other, and sometimes confused each other. It wasn't the dashboard that drove the argument and reflection. It was the human interpretation of what was on it, using the language of data. My previous article explores the concept of thinking of data as a language, the language of impact.
Once I considered all the elements of the experience, I realized I needed a solution that was not just a chat. I needed a whole world. I needed some intelligence (artificial or human) that knew the full context: how the data was collected, who collected the data, when they collected it, etc. Ideally, this world had to have the full backstory I created for the fictitious pilot. There was also fundamental knowledge that needed to be included in this world. Then, we had to have characters: sales folks who completed the pilot, their managers, etc. I needed characters who were aware of these world facts (like pilot data), even aware of each other. Because data is never reality, but just a snapshot of a specific point of view. And any dashboard we build has an even narrower purpose (either to explore or explain). So, instead of trying to make the perfect static dashboard, we just need the dashboard to be intelligent.
What If You Can Just Talk To The Dashboard Itself? A Living Dashboard?
If a dashboard is represented by a character you can talk to (who is also aware of the facts of the world), it needs to have its own personality, communication style, personal knowledge, point of view, etc. And beyond that, if I could also "train" it somehow to explain data literacy to users within the scope of the pilot data I created, that would be awesome. For example, when users ask about a specific metric, it would use my suggested analogy to explain it but beyond that, it could support the analogy with general information.
This is how I started with the initial design of Dr. Dash, a living dashboard you can ask about its data. Why Dr. Dash? My fictitious sales pilot takes place in a medieval setting. Dr. Dash Swift is a smart advisor about how to approach data.
You Need To Calm Down!
Literally, we must fight the temptation to jump into solutioning when the business says they need training on [X]! We are passionate experts in learning. When we see a metric the business cares about, we often jump in to move the needle as fast as we can. We need to calm down. Ask the right questions. Understand what's behind that metric. Understand the context and what drives that metric. Otherwise, we may end up finding a solution that solves a problem we never had.
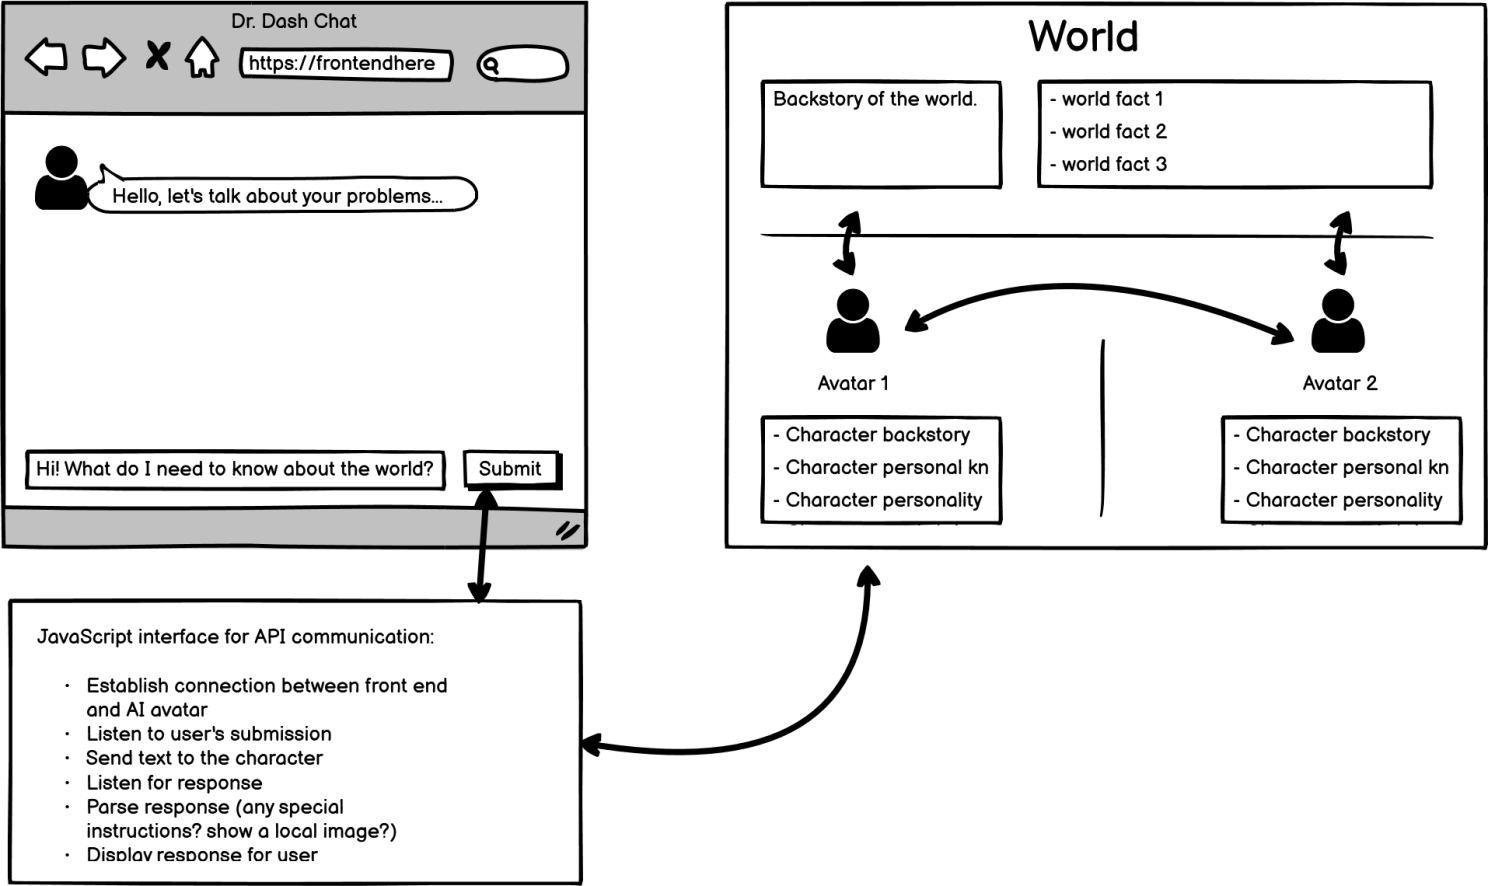
Image 1: Initial sketch of the world
We often only share polished end products or solutions and not early design approaches, so I thought I would add the initial sketch about how I imagined this app would work. Now that I had a specific problem to solve, it was easier to shortlist potential AI solutions that would be practical and effective at the same time, something that would allow me to have a front-end chat communication piece that I can build, and provide an API for back-and-forth chat with the character and the world.
The User Story
In my initial sketch of the interaction, I imagined the following user story: the user enters their name, so Dr. Dash can talk to them. Then Dr. Dash introduces themselves as a living dashboard, if possible even displaying the dashboard itself. This chat component will be separate from the backend AI. While I had the expertise to build something from scratch, I found a good starting point on Codepen. Credit goes to Fabio Ottaviani's concept of a fake chat. Note that AI can now build code from screenshots as well. You can test it out if you're interested.
Once the initial exchange happens between Dr. Dash and the user, the user can type in any question, comment, request, etc. My front-end app would send this message to the AI backend of Dr. Dash, who would then reply using an API. Then, a message would show up in the chat. Dr. Dash will be aware of specific facts about the pilot and use them in her response (261 sales folks, 85 or above average score, etc.). These are world facts that she relies on in her conversations.
What About Specific Images Of Charts?
The last thing to figure out was how to show images in the chat that are not part of the conversation and yet relevant (such as a chart from the dashboard) since I wouldn't have control over the conversation. For example, if the user specifically asks for chart 2 on the dashboard, ideally, Dr. Dash would show the image in the chat.
As I was building out the character of Dr. Dash, I also realized I did want to take control over some of the answers, while letting her improvise for others. For example, when the user asks about the Likert scale or ratio vs. interval data classification types, I wanted Dr. Dash to use a certain analogy without scripting it.
When a user asks about "Likert scale" or "ratio data" or "interval data" explain the difference with the analogy of temperature and height. Height is a ratio data because it has an absolute 0 value. Therefore, something that measures 10" is twice as tall as something that is only 5". But, temperature measured in Fahrenheit does not have an absolute 0. 0F does not represent the lack of temperature. Therefore, it is an interval type. You can't say that 80F is twice as hot as 40F.
How Do You Build An Interaction Like That?
So far, everything worked. In theory. But how do you build an application like that? There are several AI options to choose from. This fictitious project did not have any propriety data, so I didn't have to worry about data security and privacy. At least, not about the source data. However, it should be clear for users what happens to the discussion itself. Overall, I was looking for the following capabilities:
1. Ability To Create A World With A Backstory Where Characters Live
I wanted to be able to create a world with the backstory of Medieval Land, with regions, salespeople, and the pilot. Characters would share knowledge about the world but they would have their own personality, personal knowledge, flaws, goals, etc. It would be a big plus if they could even have relationships with each other. For example, in the long run, I'd love to have a manager character included that participants can interview. This manager may have limited information about other managers but certainly some attitude toward them.
2. Ability To Include Specific Common Knowledge And Facts
Characters should be able to share basic facts and specific information about how the pilot was conducted. For example, I set up a set of facts for Medieval Land where the pilot took place, and then facts about each chart on the dashboard. Inside Medieval Land, I described the pilot process. This information then can be "known" by any of the characters in the world. AI relies on these when asked about specifics, without me dictating when and how to use this information.
3. Characters Can Have Their Own Personal Knowledge, Attitude, Goals, Flaws, Limited Information
To make the simulation realistic, I needed these characters to have their own life with motivation, attitude, goals, etc. Basically, they needed a personal lens to see the world. One of the fundamentals of data literacy, that my participants realized after the hands-on session, is the amount of assumptions and biases that you can bring to the table. When ten people are looking at the exact same chart and they can't agree on the meaning of the chart, it tells you something about how your brain can fill out gaps of information without you ever realizing it.
4. The API
The front end of the chat serves the UX purpose of the communication. The solution needed some sort of simple web API to send requests and receive information. Setting this up might require some JavaScript knowledge, especially if you want to "intervene" sometimes in the chat, such as showing a specific image of the chart that is not part of the AI service.
What Are The Potential Solutions?
While there are a multitude of AI applications (growing every day), some of the best contenders on my list were: ChatGPT with custom GPTs and inworld.ai which already has built-in game world features. Finally, Google just released Gemini, which I still need to explore.
Overall, the conclusion is: do not start with the solution in mind. Define your problem and design your ideal workflow without the limitations of any tech. And remember to calm down!
Image Credits:
- The image within the body of the article was created and supplied by the author.