
How To Use Burndown Charts In Agile Development
Burndown charts are graphs that give an overview of progress over time while completing a project. As tasks are completed, the graph “burns down” to zero. In our ebook The Agile Guide To Agile Development, we recommend tracking daily progress, and an essential tool for tracking progress is keeping burndown charts.
The Agile Guide To Agile Development
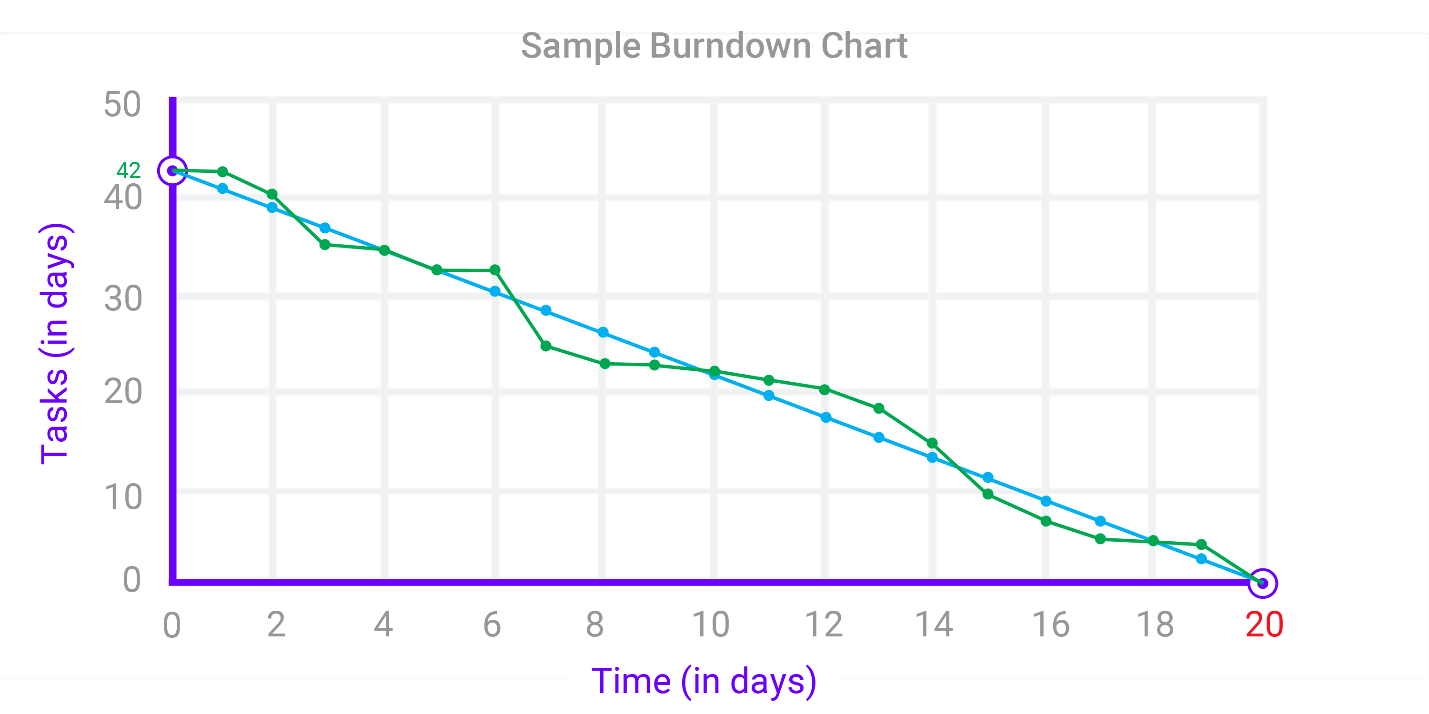
Here is an example of a completed burndown chart for a project. This chart consists of 8 important components.
The 8 Components Of Burndown Charts
First, burndown charts show the relationship between time (most commonly shown on the y-axis) and the amount of work left to complete or finish a project (commonly along the x-axis).

1. Time (Horizontal Axis)
Time is often represented with days since the project started, but sometimes in Agile Development time is the number of sprints (with a set sprint time). For example, the graph could read 21 days or three 7-day sprints.
Burndown charts can encompass the entire project, a project burndown chart, or a single sprint.
2. Work Left To Complete (Vertical Axis)
The work left to complete a project is the sum of task estimates. To estimate the time for tasks in Agile Development, see our article on using the Fibonacci Sequence. The estimate of work left to complete can be either in time or story points.
In addition, built into the chart is a start and ending point.

3. Start Point (Estimated Work)
The start point of a project is the total number of tasks in the project. For example, this project started with 42 days of estimated tasks.
4. Finish Point (Estimated Time)
The end-point of a project is when you calculate you will have finished all of the tasks based on the number of tasks, the number of team members, and an estimated efficiency factor. For example, let’s say that for the given estimated 42 days of work, you have 3 Instructional Designers who you expect to be working at about 70% efficiency. Therefore, you expect the work to be completed in (42 ÷ 3) ÷ 0.7 = 20 Days.
The next important part of burndown charts are the lines. Burndown charts have two lines: estimated tasks remaining and actual tasks remaining.

5. Estimated Tasks Remaining
This is a straight line from the beginning of the sum of all tasks to the projected completion of the project. This line is just a mathematical calculation of the average tasks needed per day to complete on time, not exactly what you expect to take place. Your team will inevitably take longer to complete some tasks and less time to complete others. The example above shows that 42 task points at the beginning of the project are expected to take 20 days, for an average of 2.1 per day.
6. Actual Tasks Remaining
This line is the actual work remaining at each point in time throughout the project. This line is what your teams should be updated on (on daily basis) to understand their progress against the estimations. For example, let's say one day your team finishes 2.6 days of estimated work, and the next day they complete 1.5 days of work. Over those 2 days, they have completed 4.1 days of work, and are essentially on course with the estimates.
This is an important part of reading burndown charts. This is how you can measure performance.
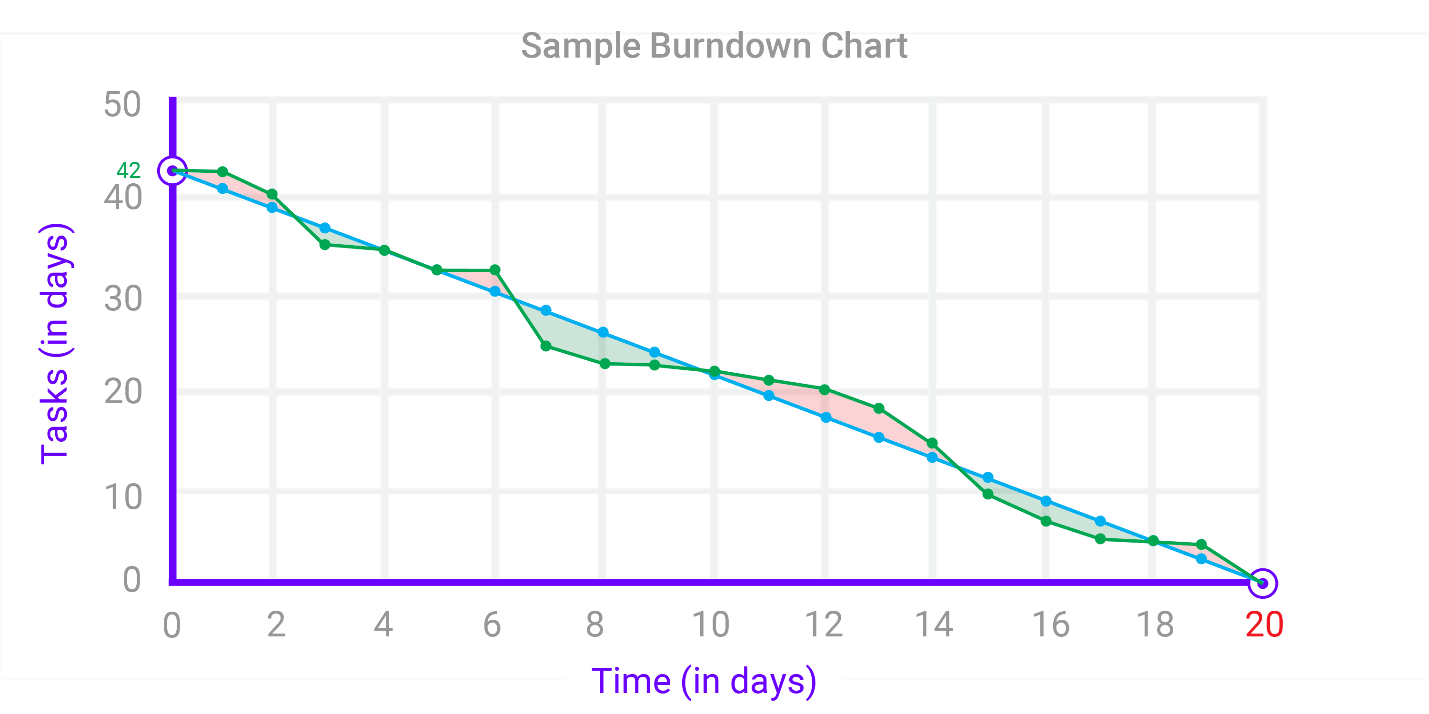
7. Ahead Of Schedule
When the actual work completed line is below the estimated, your team has completed more work than estimated and is ahead of schedule.
8. Behind Schedule
Conversely, when the actual work completed line is above the estimated, your team has completed less work than estimated and is behind schedule.
However, please remember from the Agile Guide and our article on estimating using the Fibonacci sequence, the purpose estimates in Agile Development is to give a broad estimate for planning purposes. If your team is off of your schedule, you need to go back and look at the accuracy of your estimates compared to the time to complete.
This is where you can improve your estimates through feedback. If your team is consistently under or overestimating a certain type of task, adjust your estimates to better match the actual time to complete.
To learn more about shifting your team to Agile Development download our ebook, The Agile Guide To Agile Development.
Related articles:
1. eBook: The Agile Guide To Agile Development
2. 5 Reasons Using The Fibonacci Sequence Makes You Better At Agile Development
3. What Is The Fibonacci Sequence? And How It Applies To Agile Development