What A Flexible Online Timeline Maker Can Do For You
In Time.Graphics, the free online service launched by IT Specialist Eugene Mustafin, an average of 500 timelines are created daily. Timelines and graphs are easy to create and can be done within minutes by exporting data from various services—Google Analytics, Google Console, Google Play, YouTube, and so on—into the timeline you wish to create. Time.Graphics uses the same privacy principals as YouTube, allowing you to decide whether to make your timeline private, accessible by link, or public.
“You can also synchronize your timelines with the services, containing information, for example about oil prices, exchange rates and share value,” said Mustafin. “Your timeline will be automatically updated and contain the whole range of necessary information."
Mustafin launched the website after spending hours preparing a timeline for investors. “I thought hundreds of people around the world are faced with the same problem every day and decided to help them by creating this site”, Mustafin said.
The site is great for students, teachers and professors, marketing managers, startup creators, SEO specialists, website owners, and anyone that is interested in any topic.
Any historical events spread out before you!
- Illustrative studying the events that took place in the past.
- Infographics of historical events, dates, and historical periods.
- Simple and understandable studying the history of any object, such as a state, an enterprise, a product or a personality.
- Possibility to easily compare and match any processes and results.
- Finished analytics for forecasting future processes in politics, in life, on the internet and in companies.
For Studying
The timeline demonstrates any processes of the world’s history. It provides you with possibility to compare, put together, collate and analyze any data. Using our service, you can open the history many times, see new cause-and-effect relations and quickly understand the development process of a civilization or a state.
For Business
The timeline will help to quickly and easily carry out planning your business processes and projects, analyze you enterprise’s capabilities and make correct predictions. This is an indispensable tool for those purposes where you need to plan projects accurately and meet high standards of work. It’s impossible to miss something using Time.Graphics!
For Yourself
With the help of the timeline, you can keep track of your personal achievements and results. Your historical events will help you understand what is happening in your life, where you are going and at what speed you accomplish identified goals. You simply enter all the data in it every day. And there will be an understandable visually appealing map of events and trends of your life spread out before you. Note the desired goals and events in the future to know exactly where you are at present time and where you are going along your life journey.
How To Use Time.Graphics
This is how you can use TG:
- Sign up on the website Time.Graphics. This can be done through Facebook, Linkedin, Twitter, and Google+. Then on the main page, click "create". You will see the editor window.
- Select the theme of the timeline: A light or dark background, set access. The graph can be made public, private, or available only by link.
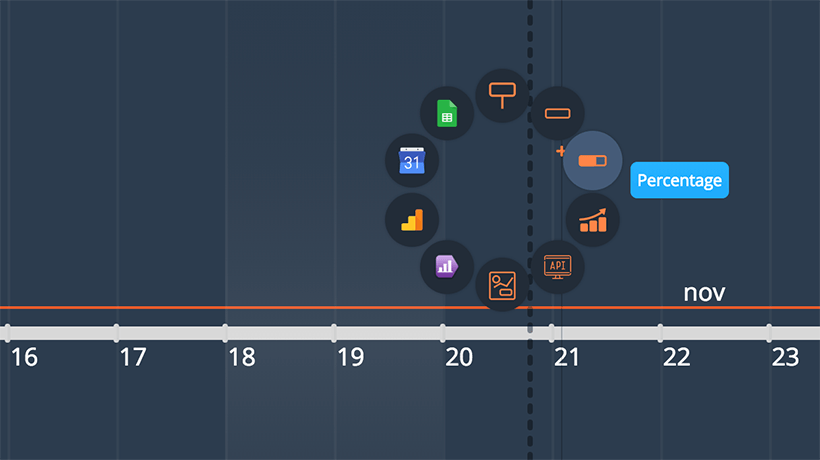
- You can begin entering data. To start, select the year you want to begin with. Click on it and select the action: mark the event, the time period to display the statistics. For each value, you can choose the design, color of text and position on the tape. In the schedule you can enter statistics from Google analytics or Yandex.Metrics. To do this, the app prompts you to log in to your account. And if it is tied to web site Analytics, the result will automatically appear in the timeline. You may add photos, videos, images, and mark the location of the icon. The tape can be scaled from hours to billions of years. The chronicle can be edited by multiple users.
- When your timeline is ready, press the "save" button. Select the area that will be the main image, name and short description. Now you can share it via social networks.
You can edit your timeline at anytime. If you have configured public access, then users can rate your work. Popular timelines created in the application are collected in a separate section. Here you can check out the examples of the different timelines.


