
Visuals Shape eLearning: 6 Ways You Can Level Up Your Course
The role of visuals cannot be underestimated in an eLearning course. When it is just the learner and the screen, visuals are strategically used by learning designers to capture the attention of learners and hold it.
Put yourself in the shoes of your learners—would you like to read pages of text on a new product or prefer a visual that has neatly labeled parts with hotspots, and rollovers? You would obviously prefer the latter. Let’s accept it; visuals are too good an opportunity to pass up if you want to capture your learners’ attention, improve their comprehension, and increase retention.
The Role Of Visuals In eLearning
- Visuals do a lot more than making your eLearning courses look attractive. With visuals, it is easy to convey and simplify the presentation of complex concepts or processes using charts, infographics, or graphical representations.
- Learners remember information with greater accuracy and for a longer time if it is presented in a visual format.
- When concepts are paired with related images, learners retain a greater percentage compared to just text or audio. This, in turn, accelerates the learning process.
The bane of eLearning designers—information overload on learners—can be overcome with visuals. They are used to present information in a concise and attractive way that will not be a burden on learners' cognition and will be recalled more readily.
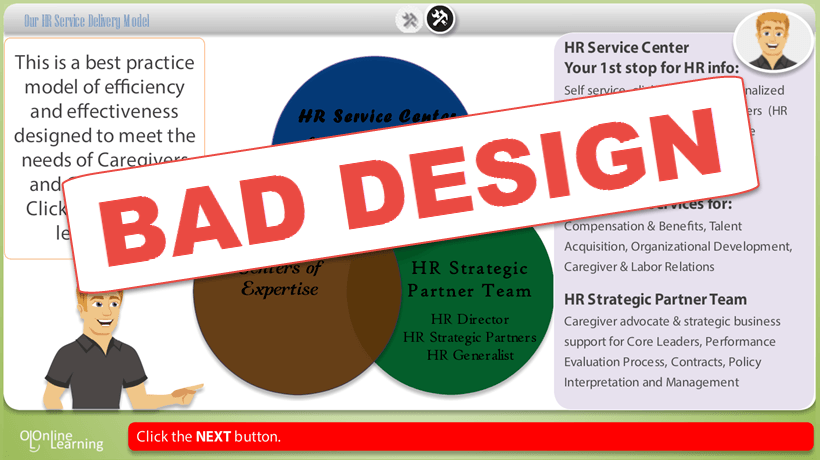
Human beings tend to process visuals faster than text because they stimulate their imagination and are easy to comprehend. They make your course visually attractive. A caveat to follow: avoid the use of visuals just for the sake of decorating your course and filling the screen because this will not help the learner in any way.
Visual Design And Instructional Design
In an eLearning course, Visual Design and Instructional Design have to complement each other. A course with great content will fail to catch attention if it is presented poorly because learners will not get what they need from it; likewise, a good visually designed course will not achieve its learning outcomes if the content is irrelevant or is not comprehensible due to poor Instructional Design.
When Instructional Designers and Graphic Designers work together, it helps to offer a better quality course that will benefit learners. One cannot function without the other, and both are equally important for the success of the course.
Types Of Visuals And Their Uses
There are a number of options when using visuals in your eLearning courses. These include photographs, illustrations, icons, charts, infographics, videos, and animations.
Photographs (real or vector) can be used to represent complex topics, tell a story, or amplify your message. They help place the content in a context and add an interesting element to the course. The photographs you use must be of high quality. Photographs learners can relate to are preferred over generic images.
Illustrations are a worthy replacement if you don’t find appropriate photographs in line with the subject of your course. Illustrations are best used to point out and explain the different parts of an object or to visually describe procedures and processes; for instance, a schematic diagram of a machine or an explanation of how to lift heavy objects. They are useful for:
- Showing spatial relationships
- Depicting the inner workings of an object
Icons are used to help learners form a mental representation of the text. This helps learners make sense of the content and adds an element of interest. Icons can be used to represent an idea or to transform your bulleted points.
Charts and graphs come in many forms and their versatility is useful to graphically describe various data. They are preferred over blocks of text for succinctly conveying information.
- Flowcharts are used to depict the steps in a process.
- Pie charts can represent percentages of a whole.
- Bar graphs depict changes over a period of time.
Infographics are ideal to describe complex information, processes, statistics, or even to tell a story. A lot of information can be condensed into a single infographic and presented in an appealing way that makes it easy-to-understand.
Animations are another powerful visual tool in an eLearning course. They are more powerful than illustrations because they contain action. They can be effective for explaining processes, parts of equipment, or steps of a procedure. They can also tell a story to create an emotional impact on learners.
Videos are powerful visual tools. They are used to explain complex procedures, moving parts of a machine, chemical or physical reactions, assembling or dismantling a piece of equipment, customer interactions—the list is endless. They are helpful for creating scenario-based learning and to offer just-in-time support.
GUI And Visuals
The Visual Design of your course must be in tune with the GUI and must be customized to reflect the same. You can do this by:
- Identifying the core screen layouts and matching it with the visual style guide—especially aspects such as the color scheme, types of fonts, and usage of the logo.
- Paying attention to the color scheme specific to the organization and replicating it in the visuals, such as in the icons and illustrations used in the course.
Cost And Time Implications
Implementing a visual strategy for an eLearning course calls for attention to the cost and time implications. Taking into account our experience of working with various clients and designing a number of eLearning courses, apart from the instructional strategy, we provide suggestions for the visual strategy after analyzing the content. For instance, if it is a safety training course on operating heavy equipment, we suggest the use of videos and illustrations. We also ask for the client’s inputs. Based on these discussions, we finalize the visual strategy and factor it in the overall cost of the project.
When it comes to the comparison of cost for the various types of visuals, animations, and videos are expensive than illustrations and icons. While photos, illustrations, and icons can be sourced from stock sites, infographics need graphic inputs and animations, and videos require more effort and inputs in terms of development and voiceovers. All this adds to the cost. The time taken to develop these assets has to be considered when deciding on the timelines for the project too.
Visuals play a crucial role in an eLearning course. A lot of thought and effort goes into designing a visual strategy for a course.