
Social Learning Analytics
In an earlier article on “Plug-and-Play” ecosystems, I discussed how “process-oriented” analytics would help ease instructor anxieties about the limiting view of the student experience gleaned from purely outcomes-based metrics. In this article, I want to a) clarify what I meant by “process-oriented” analytics by focusing on social learning analytics, and b) discuss why delivering social engagement data back to students through compelling visualizations can enable important opportunities for community building and diverse collaboration.
Where many cognitive approaches to learning analytics have relied on individual performance metrics and summative assessment data, Social Learning Analytics (SLA) focus on the activities students engage in connecting with each other, forging community, and co-constructing knowledge (see Buckingham Shum & Ferguson 2012). Motivated by networked theories of knowledge and sociocultural pedagogies such as Connectivism (Siemens 2004), Multiliteracies (New London Group 1996), and Activity Theory (Engestrom 2000), social learning analytics techniques investigate how learning and knowledge are embedded in the connections between people in a social context.
The rich data collected from student activities in digital learning environments propel the interest in products and tools that can deliver real-time feedback to students and instructors through visualizations of course activity. Where cognitive approaches have mostly focused on visualizing student engagement with instructional content (e.g. video lectures) and performance on assessments, social learning analytics methods primarily deploy two methodological tools for analyzing social interaction:
- Social Network Analysis (SNA) (see Cela, Sicilia, & Sanchez 2015) that focus on the strength/weakness of connections between student nodes within a network.
- Content analysis of student discussion threads (see Rourke, Anderson, et al 2001).
Insights from social interaction data can be leveraged in a number of ways, such as:
- Exploring correlations between social interaction patterns and cognitive development / content area-mastery.
- Observing the development of 21st-century digital learning competencies such as multimodal design and virtual collaboration.
- Helping instructors improve course designs and content delivery.
- Providing students real-time feedback on their social interactions with the community along with deep insights into small group dynamics and engagement patterns.
The Engagement Index: Reciprocal Validation
In social media channels, our impact is validated through views, likes, shares, comments, and remixes of our contributions. In a course, we can apply similar kinds of metrics to quantify impact, and include these data in generating a participation profile. Visualizations of this social interaction data can help students understand:
How Did “My” Contributions Advance The Collective Learning And Knowledge Of The Community?
There is a number of analytics dashboards such as Intellify and SmarterMeasure, as well as gamification elements that visualize learner progress, such as badges and points systems. Recently, UC Berkeley deployed their own student-facing analytics tool, called the “Engagement Index”. Created by Berkeley Professor Greg Niemeyer and a campus product development team, the Engagement Index debuted in his online art course “American Cybercultures” in 2014. The Engagement Index is designed to motivate and reward peer-to-peer learning through “reciprocal validation”. For Niemeyer, reciprocal validation meant rewarding students whose artistic contributions inspired interaction and prompted critical dialogue from the online course community, similar to the way students would share, critique, and celebrate each other’s work in his on-ground studio course.
The Engagement Index tool allows instructors to customize point values for student activities, rewarding students for both their engagements with the community (e.g. contributing likes, comments, and postings) and the community’s engagements with their contributions (e.g. comments and received). Students can then view their Engagement Index score and class ranking on the course leaderboard.
Aesthetics And Affect In Data Visualization
Data visualizations intend to present information, and for that information to affect us. Data artists like Niemeyer have opened up the aesthetic boundaries of data visualization and data transformations through designed interventions that mediate an aesthetic experience as much as represent data. In transforming statistical data into multisensory abstractions, while the details of data may be harder to access in the abstract, the affective nature of the experience prompts critical awareness, deep inquiry, and reflection.
In Spring 2016, I collaborated with Niemeyer and a small research group to create such an aesthetic experience with student data from the Engagement Index. We saw an opportunity to use 3D modeling and printing as tools to communicate reciprocity in peer-to-peer interactions through unique student engagement profiles and by capturing the collective transformation of the learning community. While 2-dimensional visualization tools such as line and bar graphs were effective in communicating student point accumulation and community activity (see Engagement Index Data Views), designing in 3D space offered new representational possibilities. We began by imagining how to represent complex social learning data in a coherent, aesthetic object that captured the dynamic and layered nature of social interactions online.
3D Data Objects: Community Transformations And Engagement Trees
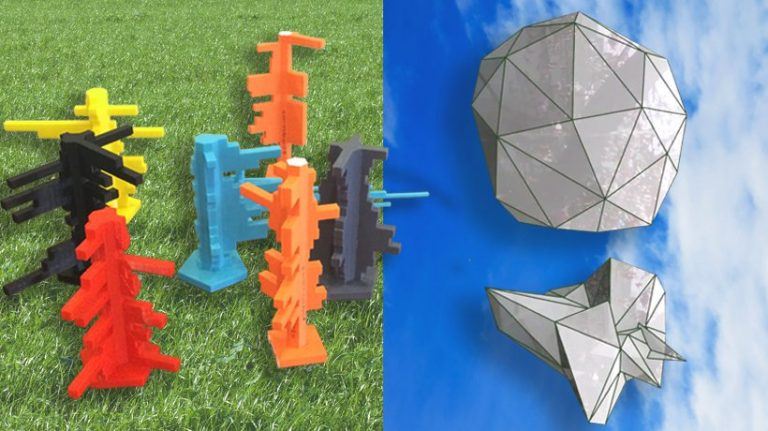
Our initial experiments focused on visualizing how variations in student engagement contributed to ongoing changes to the collective “shape” of the learning community. By mapping each of the 40 students to a coordinate along the face of a sphere, the community begins in a balanced state of connected nodes. Student activities over the 16-week course are represented by sharp fluctuations in the shape of the community. As students "give points" by commenting on and liking peer work, their nodes spike outward. As students "receive" points for having their worked commented on or liked by others, their nodes collapse inward. The jagged edges in the community’s shape at the end of the video hardly resemble the rounded edges of the sphere at the start, revealing the stark contrasts in student’s reciprocal relationship with the community. (View Community Transformations video)

While the temporal unfolding in the video dramatically conveys fluctuations in the shape of the community, it is less useful for capturing an individual’s unique engagement pattern. In designing a visualization to represent a nuance in individual engagement. Drawing inspiration from trees, we designed a hexahedron "trunk" segmented into 16 sections for each week of the course. From alternating sides of the hexahedron, "branches" extend at each level representing student engagement across three variables: Points Given (such as commenting or liking others’ works), Points Received (such as comments and likes received on my work), and Assignment Submissions. (Watch Engagement Trees video) 
The unique shape of a tree in nature aptly represents reciprocity in social interactions, where the distinct curvature and branches of the tree reflect its relationship with the surrounding environment. Digital renderings of a "forest" of Engagement Trees rotating in sync with each other provide high-level insights into unique student engagement and contribution patterns week to week. As 3D-printed objects, the mutually-affective relations between student Engagement Trees is apparent in the way contrasting student profiles appear as complementary. Like Lego blocks, Engagement Trees seem to "fit" together via their reciprocity.

Data Sculptures: The Next Badge?
When Niemeyer showed some of his present students examples of past Engagement Trees, the pure novelty and aesthetic of the object excited students. The objects offered a compelling opportunity for self-reflection about one’s participation, such as the relation between their contributions and community responses they inspired. Looking across a group of Engagement Trees also brought attention to swells and dips in both individual and community engagement, such as a week where a student was very obviously trying to catch-up on work missed from the previous, or a predictable drop in collective activity during Spring break.
More experimental than perhaps functional, our 3D prototypes reflect a demand for new techniques for visualizing social learning and reciprocity in interaction. They also raise a number of key issues when considering how we measure student contributions:
- Are students who generate impact points through provocation and only to incite a reaction really contributing to the learning community, or gaming the system for points?
- Do voices and content representative of a majority perspective receive the most interaction? If so, are students who represent non-dominant perspectives being unfairly marginalized or isolated from peer interaction?
- How do we better leverage student strengths in social interactions at the same time encourage students to develop less preferred methods of engagement?
As we move forward in designing technological, pedagogical, and aesthetic innovations in online connectivity and social learning analytics, digital environments will become more intelligent in how they organize and facilitate meaningful interactions among students. It will be important these innovations in education foster truly inclusive communities, where diverse voices aren’t merely granted access to content, but where there is genuine opportunity to contribute to the collective learning and knowledge production of the community.
The “Learning Topologies” research group was started by Professor Greg Niemeyer and senior undergraduate student MacKenzie Alessi during the Fall of 2015. I joined the group in Spring of 2016, along with undergraduate Ruta Joshi and web programmer Rian Whittle. The work was revealed at the UC Berkeley DataEdge Conference in May 2016. Learn more about the Engagement Index and SuiteC.