
Evaluating An eLearning Course: Case Study For Instructional Designers And Project Managers
Continually evaluating and analyzing your data ensures that your content remains relevant and informative.
1. Evaluate Your Course Objectives Before You Start Designing
Surveying your audience before you write your content is critical to making sure you address their learning needs. Interviewing prospective learners and conducting focus groups are 2 ways to gather this information. Design questions to find out:
- What information or support the learner needs most?
- How do they plan to access the course (desktop, laptop, or mobile device)?
- How long would they spend to take the training?
It’s helpful to have a list of proposed learning objectives that you can go through with your audience to see if they match their own learning needs. Be prepared to get widely different opinions that you will need to assimilate to come up with your learning objectives and course design.
2. Survey Your Learners After the Course Content Is Available
Once you’ve prototyped (or even launched) your course, you can get more specific feedback about your design by adding a survey at the end to collect feedback from your learners. Most users want to give input on how to make the course better. It’s helpful to ask questions about User Experience. Quantify what they felt to be the most valuable takeaways. You can also gather input about the content (whether anything should be added or eliminated). Using the information to further refine your course makes it more likely that your course remains valuable and current.
3. Analyzing Data from Your Website or LMS
In addition to adding an evaluation at the end of the course, you can also analyze the data provided by your web analytics or LMS. Both of these allow you to track user activity. You can gather information such as:
- How long a learner spends in the course.
- How they perform on interactivities.
- The number of learners who attempt the course, and the number who complete the course.
- Scores on any knowledge checks or quizzes.
This information can often inform you that your course is too long, too easy, or too difficult. Making adjustments to the content keeps your course targeted and effective.
Case Study
Our client, the California Victim Compensation Board (CalVCB), wanted to make sure they created eLearning courses that addressed the needs of their audience. Using data collected from learners, we were able to refine the courses to address feedback gathered before, during, and after course completion.
The Scenario
CalVCB provides compensation for victims of violent crime who are injured or threatened with injury. Among the crimes covered are domestic violence, child abuse, sexual and physical assault, homicide, robbery, and vehicular manslaughter. CalVCB wanted to create 5 online courses to increase 1) awareness of the program with advocates and 2) accessibility to compensation benefits for victims.
Solution
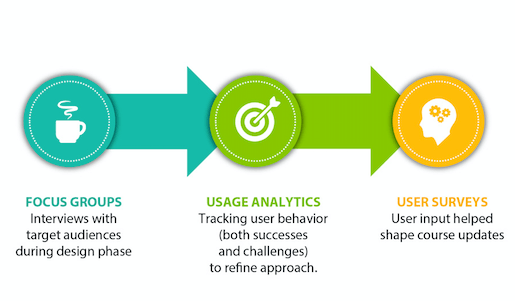
CalVCB already had a strong culture of sensitivity toward their audience. Together, we identified the importance of relying on user input and data (not just conventional thinking) as the foundation for our work. Our approach included gathering user information and data throughout the entire process of product development and iteration. The 3 ways we did this included:
Key Benefits
- Adjustments were made to the course designs as a result of the focus groups and interviews.
- The client was able to see how the learners interacted with the courses.
- Learners were able to provide post-course feedback that helped the client make further refinements.
Here are more details about each piece of the three-pronged approach.
Focus Groups
We took a user-centered approach that included extensive dialog with target audience members to gather input on course Instructional Design and style. Here are some of the key findings based on these focus group conversations:
- Because victims are often traumatized by a violent crime, certain images, or scenarios used, might trigger strong emotions. It was recommended that the courses be designed to avoid triggering these negative reactions.
- Audiences wanted to make sure anything they shared during the application process would remain strictly confidential. We recommended language be added early in the courses to emphasize the confidentiality of all information included in the CalVCB application.
- Explaining why an application did not qualify was of primary importance to the learners. We made sure to address this objective early in the courses.
- Using a detailed sidebar navigation for the courses was important so that learners could go directly to the content most relevant to them.
- All of the focus group participants intended to access the courses via computers (as opposed to mobile devices).
- Most learners planned to spend at least 10-20 minutes on the initial overview course.
- Audiences expressed a need for a Spanish language version in addition to the English version. (We also created a Spanish version of the overview course.)
Usage Analytics
Our hosting of the courses allowed the collection of certain learner data. Here are some of the findings of our data tracking:
- Over 200 users viewed the course in the first 3 months.
- 70% of those who completed the course also completed the course evaluation.
- Most learners completed the course within 32 minutes.
User Feedback
User evaluations helped validate what was working and identify areas for further improvement in the courses. At the end of each course, we created some questions for the user so we could gather feedback on the course. Here are the results of the initial course evaluations:
- 95% agreed that they would take another eLearning course from CalVCB, and would recommend the course to others.
- 95% felt the course was the right length.
- 90% agreed that the course was engaging and held their interest.
- 80% of the learners agreed that they learned new information about CalVCB.
- 80% agreed that they would use the information learned to apply for benefits or help others apply for benefits.
- 80% said the course was extremely easy to navigate.
By taking learner feedback and data into account throughout the design and implementation process, we were able to create courses that were optimized for the specific needs of the CalVCB audience.