
8 Types Of eLearning Analytics To Obtain From Google And Your LMS
eLearning analytics are like golden breadcrumbs. It's our job to know where to find them and how to use them to our advantage. Every move an online learner makes leaves a virtual footprint, a speck of information that is part of the bigger picture. When eLearning professionals put all the pieces together, we can improve our eLearning course design and boost eLearning benefits. Below are two key resources that allow you to track eLearning course effectiveness and obtain Bid Data about online learners' performance through eLearning analytics.
From Google Analytics
Google Analytics can provide you with a rich source of data, especially if your eLearning course is cloud-based. It also sheds light on your website, blog, and other online platforms. For example, the amount of traffic that your eLearning site receives on a daily basis. These are a few of the data nuggets that you mine through Google analytics.
1. Time Spent On eLearning Course
The secret to creating effective eLearning experiences is striking a balance. eLearning courses that are overly challenging can frustrate online learners, while those that are too easy lead to boredom. eLearning analytics allow you to track time spent on eLearning so that you can identify issues early on. As an example, you’ve estimated that an eLearning module should take 10 minutes to complete. In reality, most of your online learners need at least 20 minutes to tackle the task. This might indicate that the eLearning activity is too difficult or online learners don’t have the information they require. There may also be a problem with the eLearning course design or an internal glitch.
2. Rapid Page Exits
Google analytics can also help you identify areas for improvement. Both in terms of the eLearning course design and online learner performance. High click-off rates are a tell-tale sign that online learners are struggling with a specific eLearning module or activity. They may not have the knowledge or skills they need to complete the task, so they move on to a different section. Carefully analyze how long online learners are spending on each eLearning activity or module, and make a note of rapid page exits. For instance, online learners who click away at the 2-minute mark, even though the eLearning activity is roughly 10 minutes long.
3. Online Learner Preferences
If you discover that online learners are quickly clicking away from your eLearning course landing page or site, personal preferences may be to blame. For example, online learners may be accessing the eLearning course on their mobile device, but are finding it difficult to navigate. Thus, if you have high exit rates, you should consider a responsive design tool that improves your mobile-friendliness. You can even determine which devices your online learners are using and then custom tailor your eLearning course to meet their needs.
4. eLearning Marketing Effectiveness
eLearning analytics give you the rare opportunity to see which eLearning marketing methods are working so that you can fine tune your eLearning strategy. However, you can also use them to determine your traffic sources. For instance, if online learners are clicking through from another eLearning course or social media page. In fact, search engine analytics even break the numbers down by geographical location, gender, age group, and device. Thus, you can use the information to create online learner personas, which makes your eLearning experiences even more engaging and inspiring.
From Your LMS
Most Learning Management Systems (LMS) feature analytics that are built into the platform. If your LMS doesn't offer these metrics, then you may want to look for a more robust reporting tool.
5. Learner Satisfaction Ratings
One of the most significant benefits of using a LMS is being able to gauge online learner satisfaction. They might say that they enjoyed the eLearning experience, but your metrics tell a different story. eLearning analytics give you the power to collect all of your survey and poll data in one centralized location. Then you can create graphs and charts to track patterns and trends. This allows you to visualize the data so that you can pinpoint issues. For example, you may discover that 50% of your online learners prefer more interactivity or multimedia.
6. Online Learner Proficiency
The purpose for attending your eLearning course is to gain new knowledge or improve skills. Your online learners need to improve their proficiency in some capacity and eLearning analytics can help you assess their performance. eLearning analytics offer you the ability to track more dynamic types of eLearning assessments and evaluate every aspect of your learners' performance. This usually involves assessing “spot checks” and eLearning course completion rates. Instead of just looking at test scores, you can see how an online learner fared during each step of the task. For example, branching scenarios and online training simulations allow you to indirectly test their practical know-how.
7. Personalized Metrics
Many Learning Management Systems offer customizable metrics that you can use to track specific eLearning analytics. For example, learning objectives or the effectiveness of certain eLearning activities. If you are looking for personalized eLearning analytics, look for an LMS that features flexible reporting so that you can obtain the information you need. This also involves an in depth needs analysis so that you can find the LMS that supports your learning goals and objectives.
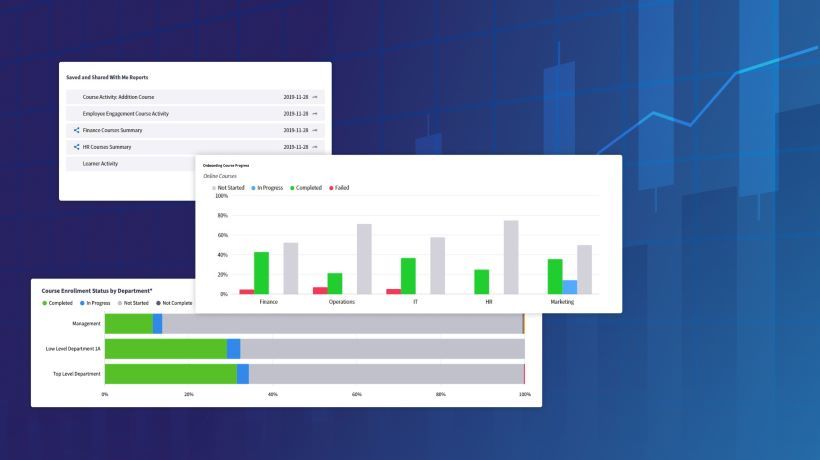
8. Online Learner Progress
Personalized feedback is essential, and LMS analytics allow you to track individual online learner progress throughout the eLearning course. Assess your online learners before and after the eLearning course, then compare the results in your Learning Management System. Create charts and tables to analyze each online learner’s performance and your audience as a whole. This information gives you the power to recommend supplemental eLearning activities and modules to fill performance gaps and improve comprehension.
One of the most significant benefits of eLearning analytics is being able to personalize the eLearning experience. You can monitor every aspect of your eLearning course design. As such, you can customize it to meet the needs of your audience. So, use these 8 tips to track your eLearning course data and then put your newfound knowledge into action.
Would you like to learn more about the benefits of eLearning analytics? Read the article 5 Reasons Why Learning Analytics Are Important For eLearning to discover some convincing reasons why learning analytics are important in the world of eLearning.