
Which B2B Lead Generation Benchmarks Matter In 2026?
Every B2B marketing team wants to know whether its numbers are good. That is where B2B lead generation benchmarks can help. Is a $150 cost per lead expensive? Is a 15% MQL-to-SQL conversion rate healthy? Should more than 20% of opportunities become customers? Without context, those numbers can be surprisingly misleading.
According to a report from HubSpot, 79% of marketers say their organization needs to become more data-driven to remain competitive. That makes reliable benchmarking increasingly important, especially when marketing teams need to justify budgets and show how campaigns contribute to revenue.
B2B conversion rates vary according to channel, buyer intent, deal size, sales cycle, qualification criteria, and go-to-market model. A high-intent demo request cannot be benchmarked against an eBook download, just as an enterprise software funnel should not be evaluated like a low-cost self-service SaaS product. The same applies to CPL. A $300 lead may look expensive until you discover that those leads generate significantly more qualified opportunities than a $75 lead from a broader campaign.
So, what percentage of B2B leads become customers? The answer depends on how you define a lead and how efficiently your funnel moves prospects toward a purchase. Your demand generation benchmarks should therefore provide a useful reference point, not become rigid targets that every campaign must hit.
In this article, we will examine the B2B lead-generation benchmarks that matter. You will also learn how to compare your numbers, identify funnel problems, evaluate pipeline velocity, and understand which metrics deserve your attention.
Key Takeaways
- Benchmark funnel stages separately instead of relying on one overall conversion rate.
- CPL must be evaluated alongside lead quality and opportunity creation.
- MQL-to-SQL benchmarks vary significantly because companies define MQLs differently.
- High-intent offers should convert differently from awareness content.
- Channel, ACV, audience, and sales model all influence what "good" looks like.
- Cost per opportunity and customer acquisition cost often tell executives more than CPL.
- External benchmarks provide context; internal historical benchmarks should guide optimization.
In This Guide, You Will Find...
- What Are B2B Lead Generation Benchmarks?
- Define Your B2B Funnel Before Comparing It
- B2B Lead Generation Benchmarks At A Glance
- Visitor-To-Lead Conversion Benchmarks
- B2B Cost Per Lead Benchmarks: What Is A Good CPL?
- MQL-to-SQL, SQL-to-Opportunity, And Win-Rate Benchmarks
- B2B Lead Generation Benchmarks By Channel
- Content Lead vs. Demo Lead: Don't Benchmark Them Together
- How ACV And Sales Model Change Your Benchmarks
- How To Diagnose An Underperforming B2B Funnel
- Build Internal Benchmarks Instead Of Chasing Industry Averages
- Lead Generation Measurement In The AI Search Era
- Common B2B Benchmarking Mistakes
What Are B2B Lead Generation Benchmarks?
B2B lead generation benchmarks give you a reference point for evaluating how efficiently your marketing and sales funnel performs. They can help you set realistic goals, plan budgets, evaluate campaigns, forecast pipeline, diagnose weak funnel stages, and compare channels using the same framework. However, a benchmark is a reference point.
For example, current B2B conversion benchmarks show significant variation even at the MQL-to-SQL stage. One recent dataset puts the median at around 13%, while other sources report materially higher rates for companies with stricter qualification models or stronger-performing segments. Your benchmarks may cover visitor→lead, lead→MQL, MQL→SQL, SQL→opportunity, opportunity→customer, CPL, cost per opportunity, CAC, sales cycle, and win rate. Together, these metrics show where your funnel performs well and where prospects stop progressing.
You can also use them to build more realistic budgets. If your target requires 50 opportunities and your historical conversion rates tell you how many MQLs typically produce one opportunity, you can work backward instead of guessing. The same approach helps with forecasting and goal-setting.
Also, channel comparison becomes more useful when you move beyond lead volume. A channel that produces inexpensive leads may perform poorly on downstream conversion, while a higher-cost channel may produce stronger opportunities and customers. That is why you should evaluate B2B lead generation conversion rates alongside lead quality, cost, and revenue outcomes. Even your top lead generation tools cannot solve a measurement framework that compares different funnel definitions.
Define Your B2B Funnel Before Comparing It
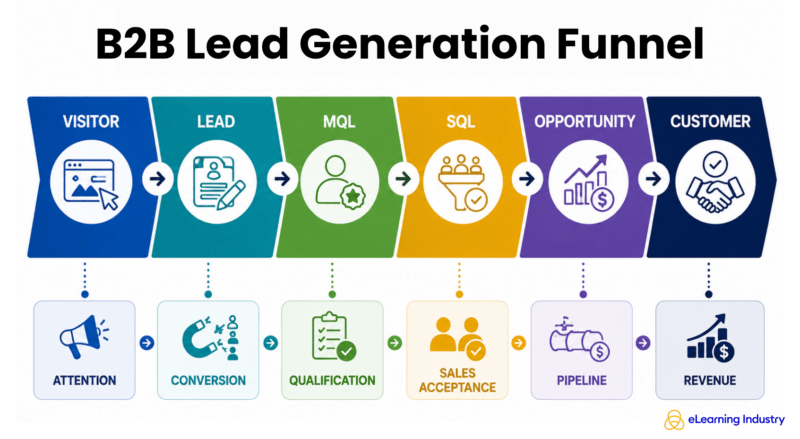
Before you compare your B2B lead generation benchmarks with other companies, define exactly what each funnel stage means inside your business. Otherwise, you may compare two numbers that look identical but represent completely different buyer actions.
A typical B2B funnel follows this path:
Visitor → Lead → MQL → SQL → Opportunity → Customer
- Visitor: Someone who visits your website, landing page, or other digital property.
- Lead: A person who provides contact information or takes an action that allows your team to identify them.
- MQL: A lead that meets your marketing team's criteria for potential fit or buying interest.
- SQL: A lead that sales has reviewed and considers ready for direct sales engagement.
- Opportunity: A qualified prospect who has entered an active sales process with a realistic chance of becoming a customer.
- Customer: A prospect who completes the purchase and becomes a paying customer.
Your company definitions can significantly change the numbers you report. Consider two businesses with very different MQL criteria.
Company A
Every content download counts as an MQL.
Company B
An MQL requires:
- A target account
- A relevant job title
- A defined engagement threshold
- A clear intent signal
Naturally, Company B should report a higher MQL→SQL conversion rate because its marketing team sends fewer but more qualified leads to sales. The same principle applies when you compare B2B funnel benchmarks or marketing-sourced pipeline across companies. Before you evaluate your full-funnel marketing strategy, make sure you compare the same conversion event.
B2B Lead Generation Benchmarks At A Glance
| Funnel Metric | Typical B2B Benchmark | Strong Performance | Biggest Variable |
| Visitor → Lead | Research | Research | Traffic + offer |
| Lead → MQL | Research | Research | Qualification |
| MQL → SQL | Research | Research | Lead source + scoring |
| SQL → Opportunity | Research | Research | Sales qualification |
| Opportunity → Customer | Research | Research | Product + sales |
| CPL | Research | Research | Channel + deal value |
| Cost/Opportunity | Research | Research | Lead quality |
| Sales Cycle | Research | Research | ACV + complexity |
If you are researching B2B lead generation benchmarks, you will quickly notice that different studies report different results. MQL-to-SQL conversion, for example, can vary based on industry, funnel definitions, lead sources, and qualification criteria.
One 2026 benchmark analysis reports a 13% median MQL-to-SQL conversion rate, while another dataset reports a 13.7% median and a 28.4% top-quartile rate. These figures offer useful reference points, but they do not represent universal standards.
That distinction matters when you evaluate your B2B win rate, CPL, or qualified pipeline. A channel with a higher CPL may still generate better downstream results than a cheaper source. Therefore, use the table as a starting point, then check each study's methodology and definitions before comparing your performance or choosing the best business lead generation ideas.
Visitor-To-Lead Conversion Benchmarks
Your visitor to lead conversion rate can tell you how effectively your website turns traffic into identifiable prospects. However, sitewide averages have limited value because the definition of a lead changes from one company to another. A visitor who downloads a checklist has a different level of intent from someone requesting a demo.
Consider these common offers:
- Low-Intent
- Newsletter
- General eBook
- Checklist
- Medium-Intent
- Research
- Webinar
- Assessment
- Buyer guide
- High-Intent
- Pricing request
- Demo
- Consultation
- Trial
Current B2B datasets commonly place website visitor-to-lead conversion around 1%–5%, depending on traffic quality, industry, and offer. One 2026 benchmark reports a 2.4% median, with 5%+ representing top-quartile performance.
That range gives you a useful starting point, but your average B2B lead conversion rate needs more context. If your site attracts mostly research-oriented visitors, you may see lower conversion than a site built around demo requests. Similarly, your lead to MQL conversion rate can reveal whether those conversions represent genuine prospects. From there, B2B lead nurturing strategies can help move qualified contacts toward sales.
B2B Cost Per Lead Benchmarks: What Is A Good CPL?
Data-driven growth requires you to look beyond a single number. Your CPL tells you how much you spend to generate each lead:
CPL = Campaign Spend ÷ Leads Generated
However, B2B CPL benchmarks can quickly become misleading when you treat them as a measure of campaign success. A $50 lead that never reaches sales may cost you more than a $300 lead that regularly creates opportunities. Therefore, evaluate CPL alongside other lead generation metrics and consider:
- Channel: Paid search, social, content, events, and industry platforms can produce very different costs.
- Offer: A newsletter signup usually costs less than a demo request.
- Buyer: Senior decision-makers often cost more to reach.
- Industry and geography: Competition and audience availability affect acquisition costs.
- Deal value: Higher-value opportunities can justify higher acquisition costs.
- Qualification level: Stronger intent usually matters more than raw lead volume.
Consider two campaigns:
- Campaign A: $50 CPL × 100 leads = $5,000 → 2 opportunities → $2,500 per opportunity
- Campaign B: $150 CPL × 40 leads = $6,000 → 10 opportunities → $600 per opportunity
Campaign B looks worse in a CPL dashboard but performs dramatically better commercially. The goal isn't the cheapest lead. It's the most efficient route to profitable pipeline.
Do you want to stay updated regarding the latest eLearning news? Subscribe to our newsletter and never miss a beat!
MQL-to-SQL, SQL-to-Opportunity, And Win-Rate Benchmarks
Your B2B lead generation benchmarks become more useful when you examine what happens after a lead enters the funnel. These stages show whether marketing attracts viable prospects, sales identifies genuine opportunities, and qualified pipeline turns into revenue.
MQL → SQL
Your MQL to SQL conversion rate shows whether marketing sends sales viable prospects. Investigate:
- ICP fit, lead source, and intent
- Scoring and sales acceptance
- Follow-up speed
SQL → Opportunity
Your SQL to opportunity conversion rate shows whether accepted leads represent genuine commercial opportunities. Examine the prospect's problem, urgency, buyer authority, product fit, budget, and timing.
Opportunity → Customer
Your opportunity to customer conversion rate shows how effectively qualified pipeline becomes revenue. Look at positioning, competition, pricing, proof, sales effectiveness, procurement, and implementation risk.
Current benchmark sources commonly place MQL-to-SQL conversion around 13% overall, while stronger performers can exceed 20% with tighter qualification. Treat these figures as reference points because lead source, sales process, and a brand awareness campaign can significantly affect results.
B2B Lead Generation Benchmarks By Channel
| Channel | Typical Intent | Most Useful Benchmarks |
| SEO | Mixed | Lead quality, opportunity conversion |
| Google Ads | Medium–High | CPL, cost/opportunity |
| LinkedIn Ads | Mixed | ICP fit, CPL, opportunity rate |
| Content | Low–Medium | Lead→MQL, assisted pipeline |
| Webinars | Medium | Attendance, MQL, opportunity |
| Mixed | Response, conversion, opportunity | |
| Events | Medium–High | Meetings, opportunities, pipeline |
| Industry directories | Medium–High | Referral conversion, qualified buyers |
| Referrals | High | Opportunity + close rate |
Channel performance can look very different even when two campaigns target similar buyers. That is why lead generation benchmarks should focus on the channel and the buyer journey rather than one combined CPL figure.
SEO may generate lower-intent traffic, while Google Ads can capture prospects actively searching for solutions. LinkedIn Ads can work well for precise ICP targeting, although costs vary considerably. Webinars, email, and events can produce stronger engagement when your audience already knows your brand.
Industry directories deserve particular attention because they can reach buyers further along in their research and evaluation process. Someone comparing vendors, reviewing solutions, or searching for a specific provider may have stronger purchase intent than someone encountering branded content for the first time.
For example, PPC lead generation through a specialized industry platform can help you reach buyers actively exploring vendors. Track referral conversion, qualified opportunities, and pipeline contribution rather than judging the channel by CPL alone.
Content Lead vs. Demo Lead: Don't Benchmark Them Together
Marketing teams often make the mistake of comparing every lead using the same standard. However, B2B lead generation benchmarks by channel become much more useful when you consider the buyer's intent and the role of each campaign.
A content lead usually signals early interest, research, or problem awareness. Common examples include:
- eBook downloads
- Research reports
- Webinar registrations
A high-intent lead shows stronger signs of vendor evaluation and commercial interest. These leads may request:
- A demo
- Pricing information
- A consultation
You should compare both lead types using metrics that reveal what happens after the initial conversion:
- CPL
- MQL rate
- Opportunity rate
- Revenue per lead
- Time to opportunity
A content campaign may generate hundreds of leads through branded content and webinar marketing, but produce fewer opportunities. A demo campaign may generate fewer contacts but move them toward sales much faster. Therefore, compare cost per opportunity and downstream revenue alongside lead volume and lead quality.
How ACV And Sales Model Change Your Benchmarks
Your B2B lead generation benchmarks can look very different depending on your average contract value and sales model. A $500 CPL might be impossible for a €1,000/year product and excellent for a €100,000 enterprise contract. Therefore, you need to judge acquisition costs against the revenue potential of each customer.
Low-ACV / Product-Led
For product-led businesses, focus on:
- Lead and trial volume
- Activation
- Trial→paid conversion
- CAC
Sales-Assisted
Sales-assisted models should pay closer attention to:
- MQL and SQL volume
- Demo conversion
- Opportunity creation
- CAC payback
Mid-Market
Mid-market teams should prioritize:
- ICP fit
- Opportunity creation
- Pipeline value
- Sales cycle
Enterprise
Enterprise teams need to examine:
- Target-account engagement
- Buying-group activity
- Cost per opportunity
- Pipeline value
- Win rate
- Deal velocity
These differences also explain why B2B funnel conversion benchmarks cannot provide a single performance target for every company. Your sales model, market, pricing, and ideal buyer persona all influence how prospects move through the funnel. A higher CPL can make sense when each qualified opportunity carries substantial revenue potential, while a lower-cost funnel may work better for products designed around high-volume acquisition.
How To Diagnose An Underperforming B2B Funnel
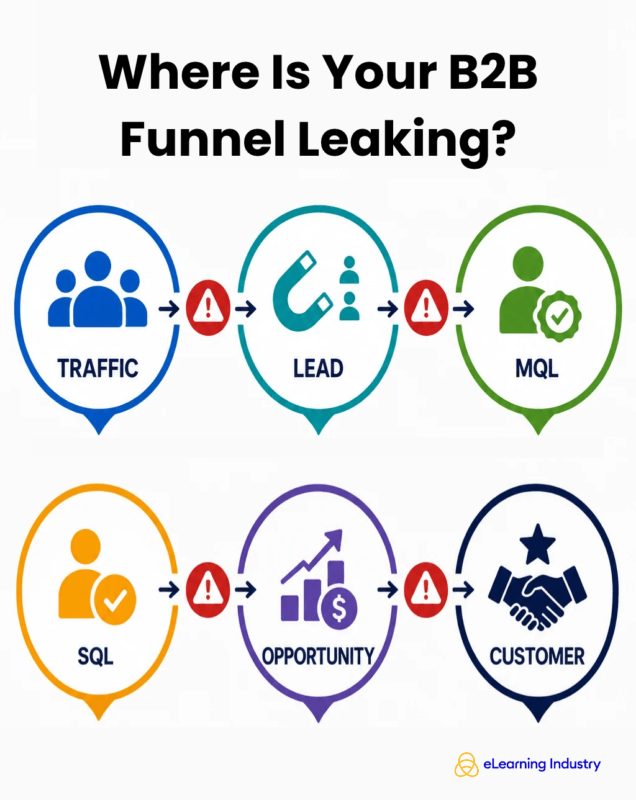
| What You See | What It May Mean |
| Lots of traffic, few leads | Weak offer / wrong traffic |
| Many leads, few MQLs | Poor targeting |
| Many MQLs, few SQLs | Qualification mismatch |
| SQLs, few opportunities | Sales discovery / urgency issue |
| Opportunities, few wins | Positioning, product, price |
| Low CPL, high CAC | Low-quality leads |
| Strong conversion, low pipeline | Insufficient volume |
| Long sales cycle | Buying complexity |
Build Internal Benchmarks Instead Of Chasing Industry Averages
External benchmarks answer, "What's happening elsewhere?" Internal benchmarks answer, "Are we improving?" For that reason, use industry data to calibrate your expectations, then build a benchmark system around your own funnel.
Build internal benchmarks by:
- Channel
- Offer
- Persona
- Industry
- Company size
- Region
- ACV
- Product
- Sales model
Track:
- Median: Your typical performance without letting extreme results distort the picture.
- Range: The spread between your strongest and weakest results.
- Trend: Whether performance improves, declines, or stays stable over time.
- Best quartile: The results achieved by your strongest campaigns or segments.
- Sample size: The number of leads, opportunities, or customers behind each result.
When comparing your numbers with B2B funnel conversion benchmarks, always consider whether you have enough data to draw a reliable conclusion. For low-volume enterprise funnels, use longer measurement windows rather than judging performance from five opportunities. A single deal can significantly change your win rate, cost per opportunity, or sales cycle when the sample remains small.
Lead Generation Measurement In The AI Search Era
B2B buyers no longer follow a simple path from search engine to website to form fill. They may research a vendor through Google AI experiences, ChatGPT, Perplexity, industry PPC directories, review platforms, communities, podcasts, or LinkedIn before they ever speak with your sales team. As a result, traditional B2B lead generation benchmarks cannot capture every meaningful interaction.
Your measurement framework should complement form-fill data with signals such as:
- Branded search: Track whether more buyers search for your company or product by name.
- Direct traffic: Monitor visits that arrive without a detectable referral source.
- AI referrals: Identify traffic that comes from AI platforms when your analytics can attribute it.
- Share of Voice: Measure how frequently your brand appears across relevant conversations and searches.
- AI citations: Monitor when AI tools reference your company, content, or expertise.
- Directory engagement: Track profile views, clicks, and referrals from relevant industry platforms.
- Target-account engagement: Measure activity from companies that match your ICP.
- Self-reported attribution: Ask prospects how they first discovered your company.
- Sales feedback: Give sales teams a consistent way to record where opportunities say they discovered you.
Do not rush to create "AI lead generation benchmarks" before reliable datasets exist. Instead, combine these signals with traditional metrics such as marketing-sourced pipeline and conversion rates. This approach also helps you understand whether brand awareness campaign examples, share of voice SEO, and other visibility efforts influence demand before a buyer becomes a measurable lead.
Common B2B Benchmarking Mistakes
1. Comparing Different Funnel Stages
Comparing lead-to-MQL results with opportunity conversion creates meaningless conclusions. Keep each stage separate.
2. Comparing High And Low-Intent Leads
A demo request and an eBook download reflect different buyer intent, so they need different expectations.
3. Using Averages As Targets
An average cost per B2B lead provides context, but it does not automatically define healthy performance.
4. Optimizing Only For CPL
Cheap leads can produce weak pipeline. Track downstream outcomes alongside acquisition costs.
5. Ignoring ACV
A $500 CPL means something different for a $5,000 contract than for a $100,000 deal.
6. Ignoring Lead Source
Paid search, referrals, webinars, and content can produce very different conversion results.
7. Mixing Enterprise And SMB
Different buying processes, budgets, and sales cycles make direct comparisons unreliable.
8. Using Poor MQL Definitions
If marketing and sales disagree about what qualifies as an MQL, your conversion data loses meaning.
9. Using Small Sample Sizes
Five opportunities cannot reliably establish a benchmark, especially in enterprise sales.
10. Ignoring Sales Follow-Up
Slow or inconsistent follow-up can reduce conversion even when marketing delivers qualified prospects.
11. Comparing Attribution Models
First-touch, last-touch, and multi-touch attribution can assign revenue differently.
12. Using Old Benchmarks
Markets change, so outdated data can distort current expectations.
13. Measuring Leads Without Opportunities
Your opportunity to customer conversion rate tells you more about commercial performance than lead volume alone.
14. Failing To Connect Marketing To Revenue
Use sales cycle benchmarks, B2B thought leadership, and content marketing for B2B to understand how marketing contributes to revenue rather than tracking leads in isolation.
Key Takeaway
B2B marketing teams should use B2B lead generation benchmarks as context, not as fixed targets. Your funnel, audience, sales model, deal size, and qualification criteria all influence what a healthy result looks like. Therefore, focus on comparing the same funnel stages and conversion events before deciding whether your performance needs improvement.
The average B2B lead conversion rate can help you spot gaps, but it cannot tell you whether your marketing generates the right buyers. Look beyond CPL and track qualified opportunities, revenue, customer acquisition costs, and pipeline velocity to understand the commercial impact of your campaigns. Your internal historical data should ultimately guide optimization because it reflects your specific audience and sales process.
At the same time, modern buyers research across search engines, AI platforms, directories, communities, and social channels before they contact a vendor. This makes a broader measurement approach essential, especially when you invest in SaaS content marketing and other awareness-focused activities.
eLearning Industry helps Learning Tech, HR Tech, EdTech, AI, and B2B technology vendors reach L&D, HR, and business decision-makers through sponsored content, eBooks, webinars, newsletters, podcasts, PPC campaigns, directory visibility, Top Lists, and targeted lead-generation programs. Instead of optimizing for the lowest possible CPL, focus on what matters commercially: relevant buyers, qualified opportunities, and sustainable pipeline.
FAQB2B lead generation benchmarks are industry reference points for metrics such as conversion rates, cost per lead, MQL-to-SQL rates, and lead quality.
A typical B2B website conversion rate is often around 2–5%, although the right benchmark varies significantly by industry, traffic source, offer, and audience.
A 15–30% MQL-to-SQL conversion rate is often considered a reasonable benchmark, but complex B2B sales cycles can produce substantially different results.
There is no universal average. B2B CPL can range from tens to hundreds of dollars, depending heavily on industry, channel, audience, and deal value.
Organic search and referrals often produce lower-cost leads, while paid search, LinkedIn, events, and highly targeted campaigns can cost more but potentially deliver higher-value prospects.
Higher annual contract value (ACV) generally allows companies to accept a higher CPL because each qualified lead can generate substantially more potential revenue.
Review performance monthly or quarterly, and update benchmark targets at least annually or sooner when pricing, channels, markets, or buyer behavior change.