


Make A Difference, Don't Just Be Right!
You are in charge of making a decision about which course to continue, and which one to discontinue, based on the following scenario:
You A/B tested two versions of the same course, Course A and Course B. In your busy workplace, you did your best to randomly select Cohort A members for Course A and Cohort B members for Course B. Both versions had the indentical pre- and post-assessments. Again, you did your best to control for any other differences between Course A and Course B except for the course design itself. The result of the A/B testing is the following:
-
- Cohort A (taking Course A) has achieved a 25% average score gain when comparing the pre- and post-assessment scores.
-
- Cohort B (taking Course B) has achieved a 32% average score gain when comparing the pre- and post-assessment scores.
Which cohort did better? And so, which version of the course should be continued?
Which Course Performed Better?
Now, since I put this scenario in an article about data literacy, you immediately suspect that it can't be as simple as it seems: bigger gains, better results. If you're new to working with data, you probably read the scenario entirely and then returned to focus on specific details. You might have scrutinized the numbers first, but then you may have reflected on qualitative words such as "random" and "better." If you've got decent experience in measurement and evaluation, you have a ton of very specific questions at this point (by the way, this article might be too easy for you).
You've Just Applied Data Literacy!
We'll get back to the cohorts later. The point of this exercise was to apply data literacy, and you've already done that. Just by stepping back for a second to reflect; to be curious about why the obvious answer may not be the correct one; to scrutinize the data points to see if they make sense, you've already started using the fundamentals of data literacy.
What Is Data Literacy And Do We Need It For L&D?
Gartner defines data literacy as "the ability to read, write and communicate data in context, including an understanding of data sources and constructs, analytical methods and techniques applied, and the ability to describe the use case, application, and resulting value." This is a mouthful and obviously covers all grounds of data. You may also wonder how this is different from data analytics, data engineering, and data science, for example. These roles are often listed in job descriptions to work with data.
Qlik's definition is more focused: "Data literacy is the ability to read, work with, analyze, and communicate with data." Meanwhile, in its data literacy course, DataCamp also adds "insights" on top of data:
Data literacy can be defined as follows: it is the ability to read, work with, analyze, and communicate insights with data. We can distinguish three main components here: reading data, working with and analyzing data, and communicating insights with data.
The Data Lifecycle
As you see, all the definitions dance around what you do with data, but the details vary and the level of depth can be vague. This may be because the data lifecycle includes data in various forms and different roles have different skill level requirements to move the data along the way. As a result, different roles may need to have a certain scale of fluency rather than a binary "literate" or not.
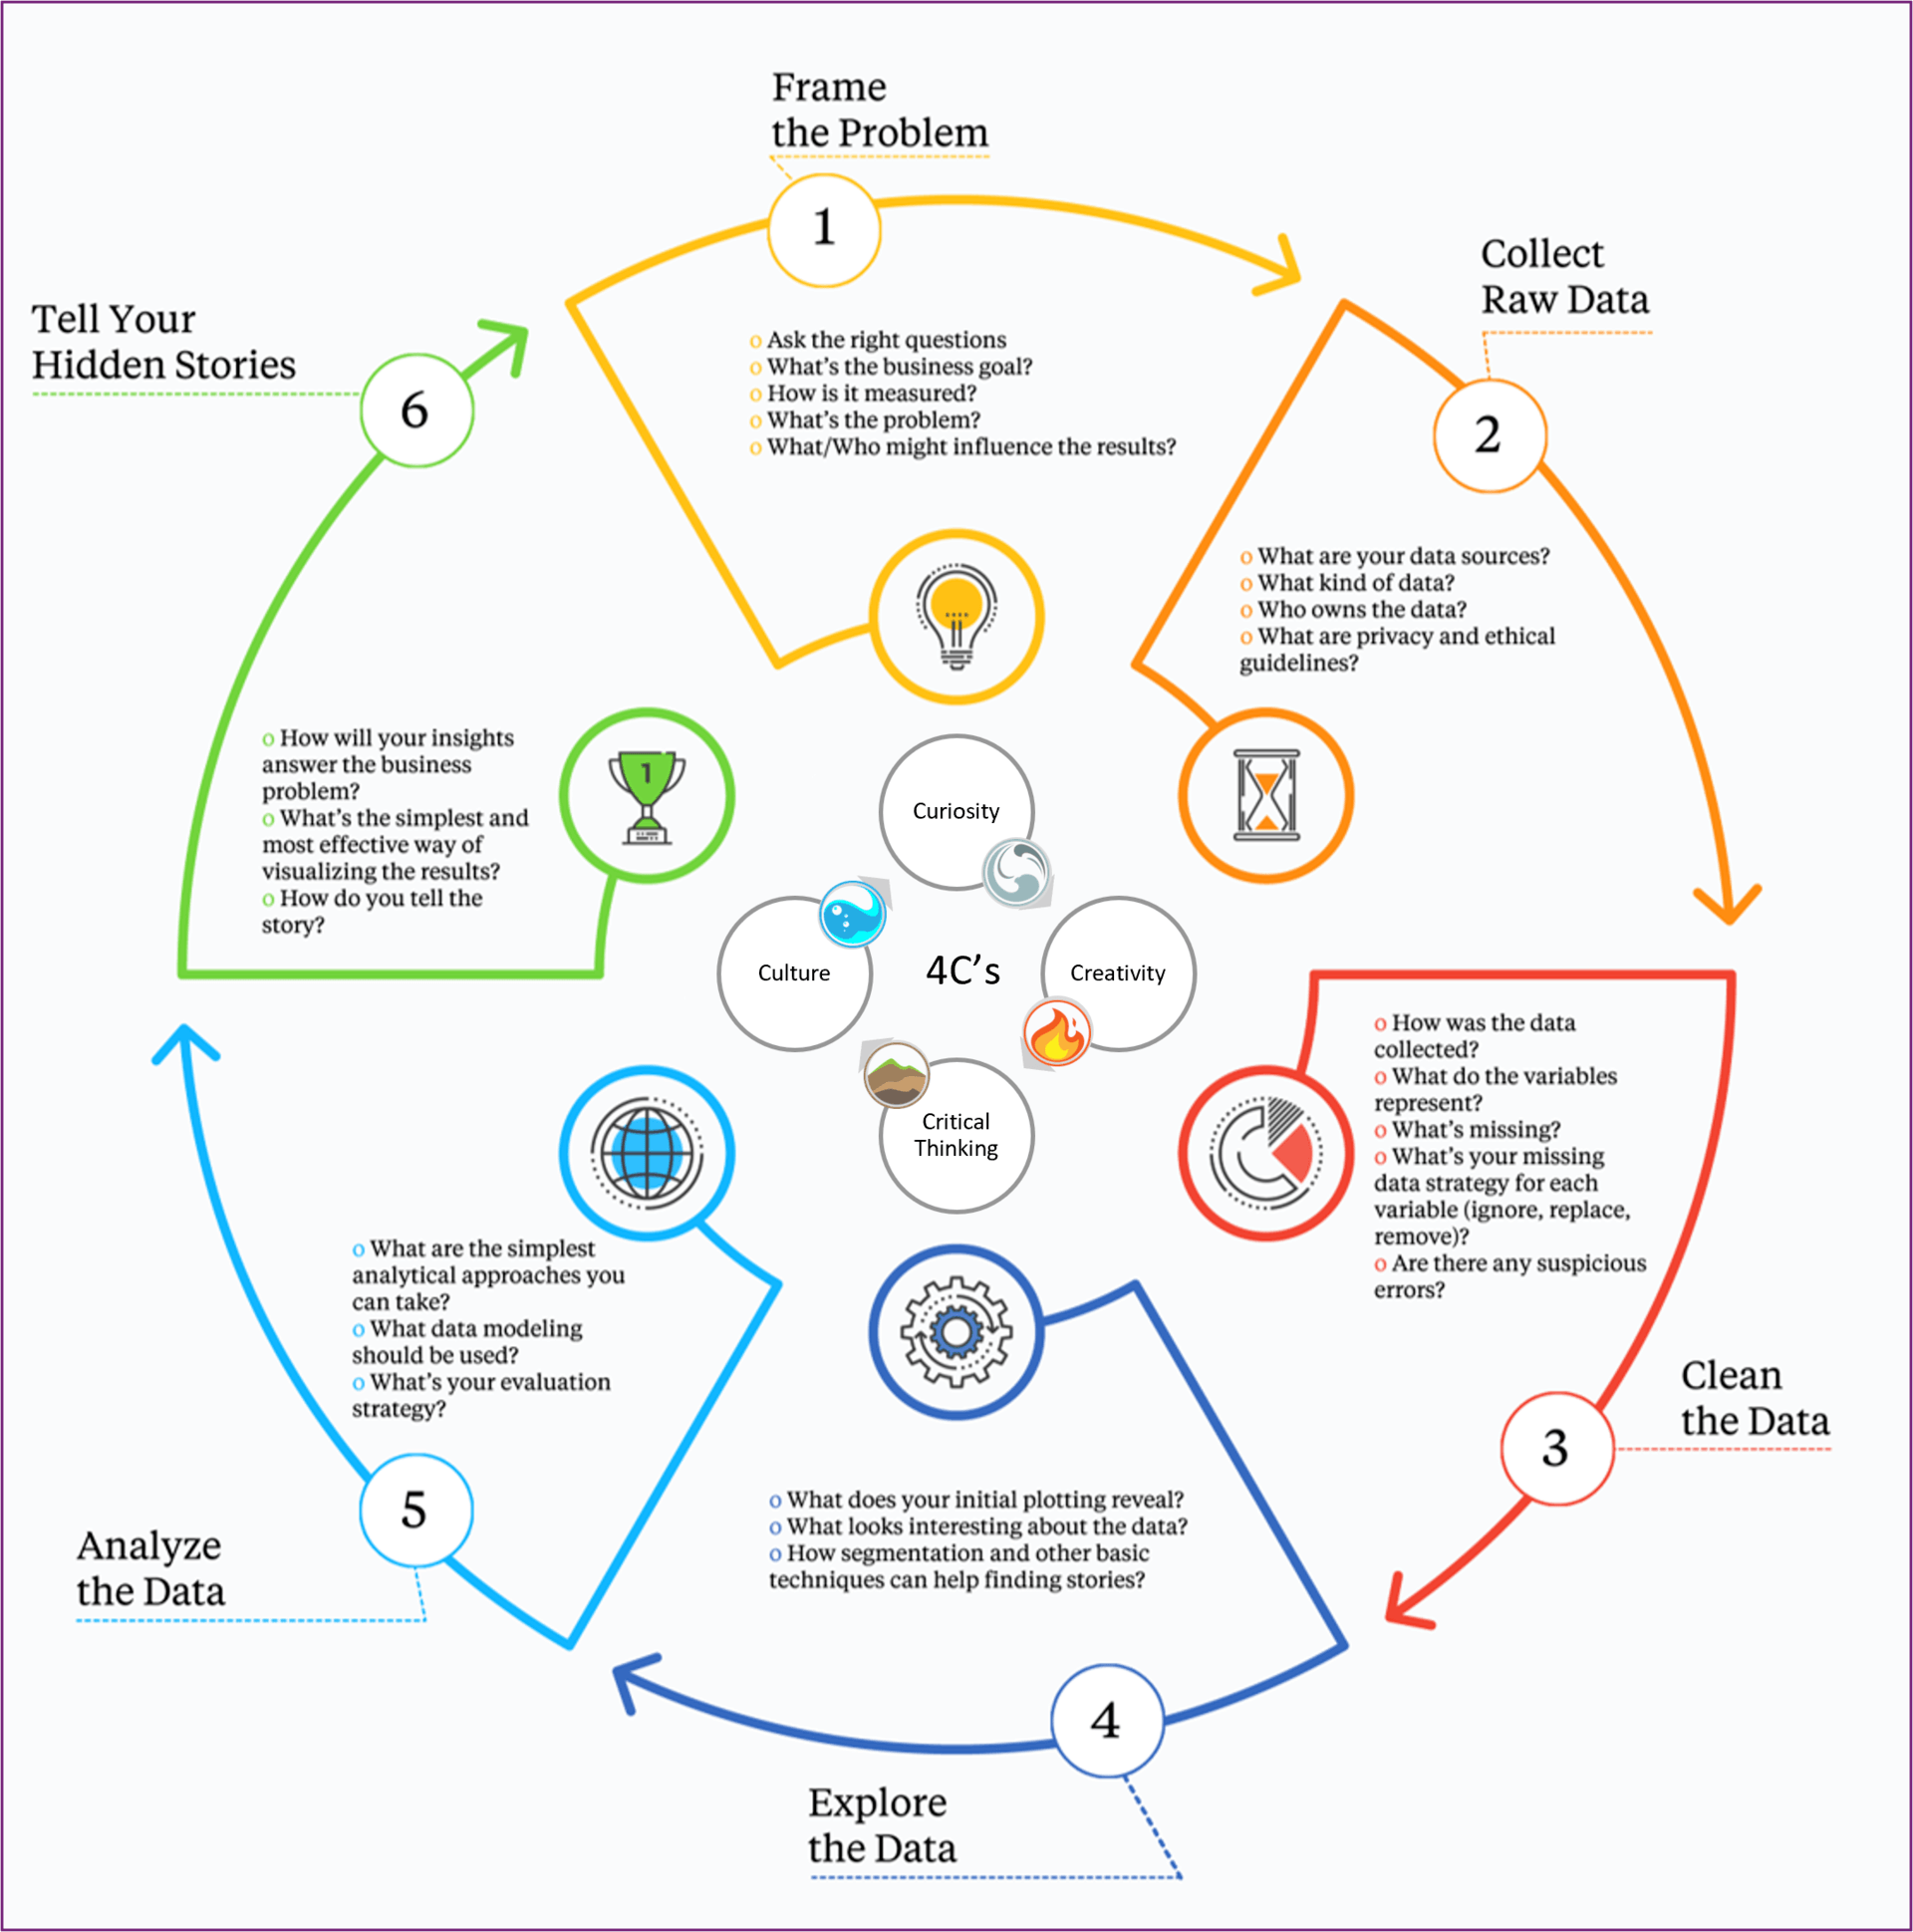
"Simplified" lifecycle of a data-driven project
Learning professionals don't always have the chance to influence the data lifecycle from the very first phase. Sometimes we join the lifecycle in progress. Data literacy is important, not because we have to be an expert at every phase of the project, but because we should be able to ask the right questions and, ideally, influence the decisions, in order to achieve meaningful actions and decisions at the end. And so, think of data literacy more as a scale of fluency than a binary term.
Jonathan Cornelissen, CEO of DataCamp, in their 2023 data literacy report, suggests the same:"Although the term suggests a binary, organizations should think of data literacy more in terms of a scale of fluency." The same report also highlights areas where data literacy is currently used and valued: "[...]interpreting data visualizations and dashboards (74%), data analysis and manipulation (72%), and data storytelling or the ability to present data to different audiences (66%) are highly valued by data and business leaders." Based on the report, many employees, and even whole organizations, might be struggling with where to start with data literacy and how to move from learning about data literacy to learning how to apply data literacy:
43% of respondents stated that videobased only learning makes it difficult to apply learned skills in the real world. Additionally, 30% of respondents stated that employees struggle to understand where to start learning, with 29% stating that even if they do understand where to get started, the skills people learn are not relevant to their roles.
"Video-based only learning"—these words made me cringe when reading the report. Passively watching an expert chef eating in a professional kitchen will not make you a Top Chef contestant. We need to stop pretending that information delivery is the same as skills development. Video can be part of the strategy, but with data literacy, you need hands-on application to improve your skills.
Is Data Literacy Worth The Effort For The Future Of Learning?
When looking to the future, 88% of those surveyed agreed that data literacy skills are foundational skills in the twenty-first century, with over half (52%) strongly agreeing that this was the case. Okay, so 88% agreed and 52% strongly agreed. This sounds convincing but I'm curious:
How much do you care if someone agrees or strongly agrees with the importance of data literacy? What do you think the difference is between agree and strongly agree? If this was a survey about something you act on, what difference would it make whether people agree or strongly agree with your statement?
For example, I rarely give a one or a five on surveys. Why? Because a one would basically trash your effort and a five would mean I will never ever find a better thing. Others start in the middle and go up and down depending on how they feel. The thing is, the Likert scale with arbitrary statements (which we turn into numbers, and even worse, averages) is subjective. There are statistical ways to control for that, but there's a bigger data literacy question for learning smile sheets: what difference does it make in your actions and decisions?
That leads to the first go/no-go decision on data literacy. If you're not planning to act on the findings, then you don't need data literacy. If you're not planning to do anything about the feedback unless it's a disaster, then it doesn't really matter whether you get a 4.3 or a 4.5 satisfaction average. Yes, it looks good as a vanity metric on the dashboard, but beyond that, it is not actionable. The mental exercise is where data literacy starts, using the 3C's of a mental model (coined by Jordan Morrow): curiosity, creativity, and critical thinking.
Where Do You Start With Data Literacy For Learning?
In an increasingly data-driven world, workplace learning professionals need to be well-equipped with data literacy skills to make informed decisions, create effective learning programs, and measure the success of their initiatives. The fundamentals of data literacy may include the following competencies:
- Basic data classification
Know what you can, can't, should, and shouldn't do with different types of data - The mental model of the 4C's
Curiosity, creativity, critical thinking, and culture - Avoiding common mistakes
- Basic learning analytics and storytelling
Finding and presenting insights to support data-informed decision-making
Basic Data Classification
An outline for this foundational knowledge may include the following:
1. Quantitative Data
This type of data is numerical and can be measured. Typical examples relevant to workplace learning professionals include:
- Course completion rates
- Average test scores
- Learning gain
2. Qualitative Data
This type of data is descriptive and cannot be measured numerically. This type of data is valuable for labeling and categorizing items. Examples for corporate learning professionals include:
- Learner feedback on course content
- Subject Matter Expert insights
- Observations of learner engagement
Which type of data do we use in learning measurement and evaluation?
Both. Quantitative data is easier to interpret and can provide trends and reveal patterns. Qualitative data can provide nuances, hidden stories, and more specific insights into the why.
The 4C's Of Data Literacy
Jordan Morrow, in his book Be Data Literate, explores the 3C's of data literacy [1]. The fourth one (culture) is my addition, that allows you to make an impact by successfully navigating your particular work culture.
1. Curiosity
A desire to explore and understand the data is crucial for workplace learning professionals. Examples include:
- Asking open-ended questions to uncover hidden insights from data.
- Investigating anomalies in learning trends.
- Continuously updating skills and staying informed about industry trends.
2. Creativity
Thinking outside the box helps in finding innovative solutions to learning challenges. Sometimes there are no existing metrics that can be directly observed and measured, and you have to be creative to find a proxy (something that you can measure to indicate the change in the original metrics). Examples include:
- Creating a measure to monitor how much time supervisors spend on answering questions that new hires should know.
- Designing a data strategy that may result in surprising insights. For example, you may want to know if there's a correlation between the attitude toward learning and application on the job.
- Calculating ROI for not creating training at all. Sometimes no training is the best training. For example, you may compare a solution that the stakeholders asked for with the UX change in the application your analysis suggested.
3. Critical Thinking
Analyzing and evaluating data objectively ensures data-driven decision-making. This means asking the question of whether the insights make sense, never assuming how and by who the data was collected, and questioning the relationship between metrics and intentions. Examples include:
- Questioning the validity and reliability of data sources or insights: does it make sense? How do we know?
- Identifying potential biases in data interpretation.
- Recognizing the limitations of data and making informed decisions based on this knowledge.
To learn more about these 3C's, read Jordan Morrow's book and explore some of the examples he mentions for each. The last C (culture) I added, because culture eats data literacy for breakfast. Our goal is not to be right but rather to make a difference. And for that, you must know how to navigate the culture.
4. Culture
Fostering a data-driven culture within the organization is essential for success. Culture also includes context, which determines what works and what doesn't in your specific organization. For example, at Amazon, we write narratives to drive change. In other organizations, you may do presentations. Whatever mechanisms are in place, you need to understand how to navigate your own culture successfully. Examples include:
- Encouraging collaboration between learning professionals and data analysts.
- Celebrating data-driven successes and learning from failures.
- Understanding what other factors might be behind certain patterns based on how the business works. For example, the rhythm of the business may lead to false insights when not considering seasonality.
What To Avoid: Common Mistakes In Data Literacy
- Jumping to solutions
This is so far the most common trap I've seen. The more passionate you are about fixing things, the more knowledge and experience you have, the more you may feel the urge to analyze data quickly to find solutions for the metric. - #1 often leads to #2: obsessing over the metric itself
When you see a chart with a red number, it is tempting to believe that your mission is to move that number into the green. Don't forget that metrics are not just numbers on charts. They represent something. The meaning behind those numbers is important. If you get obsessed with a metric, you may make decisions that impact the metrics itself but also have unintended consequences (for example, focusing on average handle time in a call center may result in dropping quality or customer satisfaction because you rush to get the call under two minutes). - Overlooking the importance of context
Data should always be interpreted within the context of the specific learning environment and organizational goals. A dashboard is not reality. It is a snapshot from someone's perspective. Beyond those numbers on the dashboard, there are humans, lives, and often workplace challenges. Always interpret data within its context and within the boundaries of how, when, and why the data was collected. - Relying solely on quantitative data
While quantitative data is valuable, qualitative data provides rich insights that help in creating a holistic understanding of the full picture. A typical example of this is learning reaction survey data (smile sheets). Your average satisfaction is a single number. Without diving deeper into the qualitative open-text feedback, you would never know that participants were satisfied with the virtual facilitator but they were critical about the length and level of application in the design. - Misinterpreting correlation and causation
Just because two variables are correlated does not mean that one causes the other. It is crucial to understand the underlying factors driving the relationship. What's interesting about correlation and causation is when you present a desirable correlation as causation, people are willing to accept it more easily. When your analysis shows unexpected or undesirable correlation and causation, suddenly, people question the significance and integrity of the process.
Finally, if your data literacy foundations are in place, I recommend building out your learning analytics strategy using Megan Torrance's book, Data Analytics for Instructional Designers [2], and the measurement and evaluation framework called Learning-Transfer Evaluation Model (LTEM) by Will Thalheimer. More to come on these recommendations in the second part of this article.
Conclusion
Developing data literacy skills is essential for workplace learning professionals in today's data-driven world. By understanding basic data classification, embracing the four 4C's, and avoiding common mistakes, learning professionals can make better decisions, design more effective learning experiences, and contribute to a data-driven culture within their organizations.
The question is: where to start? How do you start learning about the fundamentals of data literacy in a meaningful way? I've had hit-and-miss results with off-the-shelf learning experiences. Sometimes they are generic to the point that they don't resonate; other times, too academia-oriented or too specific to a type of problem that is not relevant to what L&D does. My suggestion is not to reinvent the wheel completely, but rather to supplement existing data literacy resources with customized relevant examples.
- As a foundational layer, I recommend Jordan Morrow's book, Be Data Literate. It is less about math, stats, and tactical best practices but explores what should come before all that: the mindset change with the 3C's.
- Before you go on an adventure on your own, look around within the organization and see if anyone has a program you can modify to your needs. Data scientists, data engineers, data analysts, and business intelligence analysts are good examples of where to start.
- Externally, to build on the book, explore some of the available data literacy courses that include hands-on work. For example, DataCamp has a track for data literacy. Depending on the budget and the number of team members, a boot camp or workshop may work better (such as the Data Lodge).
- Finally, think about how you support others on this journey by applying data literacy in everyday work. Measurement and evaluation strategy should include data literacy and its application for each role in the team.
In the next part of this article, I'll walk you through how we designed and implemented a narrative-driven, spaced data literacy journey that included all of the above. I'll also explain why a fake project with fake data and a fake dashboard may be a good entry point for anyone in the L&D team to see the relevance of data literacy in their work.
P.S.: I didn't forget about the cohort scenario from the beginning of the article. I'll leave you some time to reflect and come up with some questions. In the next part of this article, we'll analyze the scenario and reveal the answer(s).
References:
[1] Jordon Morrow. 2021. Be Data Literate: The Data Literacy Skills Everyone Needs To Succeed. London/New York: Kogan Page.
[2] Megan Torrance. 2023. Data Analytics for Instructional Designers. Association for Talent Development.
Image Credits:
- The image within the body of the article was created and supplied by the author.
Editor's Note: The apostrophe with single capital letters to indicate the plural is a deliberate departure from our house style, at the author's request.