
Digital Body Language And Learning Analytics
Learning and Development today should be all about the learner—what they want, what they need, and when they need it. Despite the breakthrough technologies, the current scenario of L&D is uncertain, as the need to have a clear link between training and performance increases. And eLearning is not far behind. Deriving actionable information about learners’ learning needs, pain points, and the learning intent are driving the L&D teams now. A newer concept has emerged that may have the answer to it, and that is digital body language.
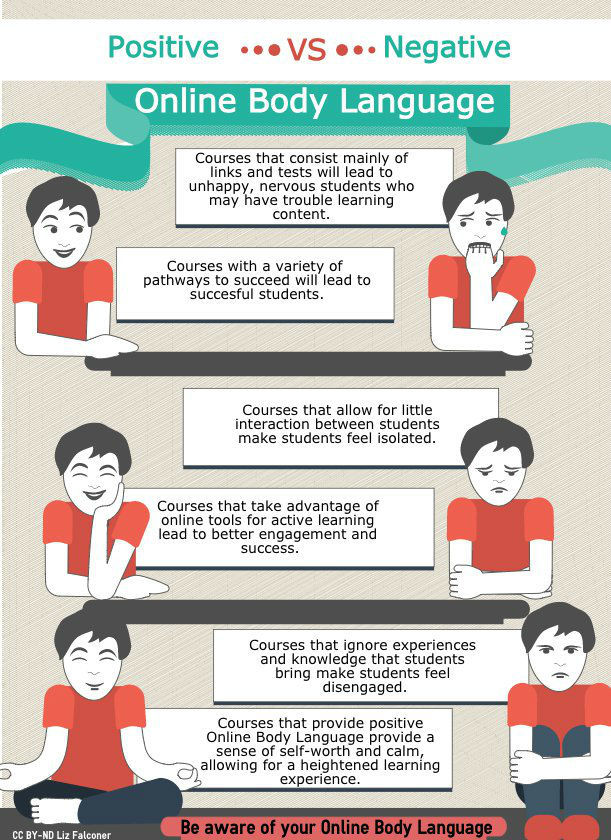
So, What Is Digital Body Language?
Consider a traditional classroom. The student and the trainer are in the same environment at the same time. This makes the trainer more aware of how engaged the student is. Accordingly, if they notice the learners are disengaged, they can see their pain points and take corrective measures to increase the engagement. This is now possible in the digital environment, too.
Digital body language, or else known as DBL, a concept made famous by Steve Woods in 2009, was used to explain the science of tapping into the signals and activities customers are exhibiting that show what they want, and when they are likely to raise their hands. DBL gives electronic signposts to a person’s interests.
Decoding Digital Body Language
"Digital body language represents everything that learners are online"
- Lori Niles-Hofmann.
DBL is the sum of all activities taken, the number of courses taken, pages visited etc. Learners might be able to hide behind their computer monitors and mobile phones, but their actions reveal key information about their interests.
Think of it like a learner’s facial expressions. Instructional Designers need this data to accurately assess where the learner is on their learning journey so that they can adapt their strategies and approach accordingly.
Making The Data Accessible
The main use of DBL is that it can be objectively measured using data. By looking at just a few figures, L&D teams can immediately understand where the learner stands, what they are interested in, and what kind of approach or strategy can be followed. Information can be collected via feedback forms, polls, or even the number of visits to the course. These can be used to score the learning strategy.
Source Of Information
The information that can be unraveled from DBL is:
- What device or browser does your audience prefer?
- At what time or day of the week do they access content?
- What content length is optimal?
- Do they prefer videos, articles, or microlearning?
- What are the potential obstacles learners are facing?
Compiling this data—and reporting it on a regular basis—is a good way to begin to bridge the content divide. But, how can we report, record, or track data at a micro-level? The answer could lie in xAPI and LRS or even custom coding.
xAPI, Learning Record System (LRS), And Custom Coding
xAPI or Experience API, the successor to SCORM, poses unique features such as offline tracking, tracking learner experience, reducing the need for an LMS etc. This gives rise to the question of how are we going to track our course without LMS? This can be done through LRS. We can track our eLearning courses wrapped in xAPI using LRS. Now, what is LRS? LRS is the heart of any xAPI ecosystem. LRS stores learning records and enables the export of raw learning data.
Now, coming to the main query, what do LRS and xAPI have to do with DBL? Adopting these technologies will help you build the right platform to decode DBL. However, only xAPI and LRS are not enough to get the complete picture. An adaptive learning platform is required, and here is where custom coding acts as a catalyst. xAPI recognizes and records learning experiences, LRS acts as a database, and custom coding gives the ability to draw the appropriate data.
On the other hand, when it comes to learning design, we need to factor into a few things. Let’s look at this next:
Data-Driven Learning Design
Data-Driven Learning Design or DDLD gives us the evidence that we can no longer push the content we believe learners should or must digest.
Here are a few ways that DDLD can help in Instructional Design:
1. Designing The Learning Objectives
DDLD gives us insights into:
- What type of media should we use?
- Is the mobile access high or low?
- When do learners log in?
Answering these questions helps us create better courses. For example, if learners are comfortable with more visuals than text on the screen, then you can consider giving concrete examples such as combining words and visuals. Depending on the learning strategy, learning objectives can be defined.
2. Content Design Decision
The intent of DDLD is to help Instructional Designers make decisions about whether to go for self-paced eLearning or a blended solution. For example, DDLD can help Instructional Designers decide when to put a quiz, what type of introduction the course will need, and when we can place a drag-and-drop or any sort of exercise.
3. Consulting And Evaluation
DDLD gives insights into how the training can have an impact on learner performance. Consulting and evaluation along with DBL help to build courses that align course objectives with business goals.
Conclusion
Digital body language helps you drill down into different levels of data and information. It’s fun to observe and learn at the same time. Utilizing the insights drawn from DBL means taking on an iterative design mindset. Instructional Designers can constantly refine and improve what they do based on what they find out to increase engagement.
To conclude, data will leave you in amazement. It uncovers a veil of learners’ preferences and helps to create courses which are more learner-centric.
So, what’s your plan for understanding the digital body language of your learners?
Loved the article? Give your feedback by leaving a comment below.
References:
The Everyday Guide to Learning Analytics