
The Everyday Guide To Learning Analytics: How To Use Data To Create Great Digital Learning Design
News agencies, media companies, and marketing teams have all been using data to inform decisions on content for years. Now, it’s Learning and Development’s turn. Data and analytics are critical for designing digital learning that works. To engage your audience, drive up usage, and get them back for more, you need data on your side to help shine a light on what’s working and what isn’t.
eBook - The Everyday Guide To Learning Analytics
But fret not. Tapping into data to help you design winning strategies doesn’t require a lab coat or complex spreadsheets with Einstein-style equations. In The Everyday Guide To Learning Analytics eBook you’ll find tips and tricks for tapping into typically available data and drawing insights that can make a real success story for your project – stats you can play back to managers and peers and use to create an even more engaging project next time.
Use this eBook to sprinkle some science onto your creative approaches, and design from a place of knowledge, not assumption.
About The eBook
Let’s take a look at the key chapters of The Everyday Guide To Learning Analytics:
- Why do you need learning analytics in digital design?
Imagine if you knew the winning formula for creating great digital learning design that engages thousands of users. There’s a wealth of data at your fingertips, turning it into actionable insights will transform the success of your project. - Think about digital body language.
Get thinking about the digital equivalents to the eye-rolls, smiles, nods and crossed arms of the traditional training room. What clues do you have about the success of digital learning? - Data sources for data driven learning design.
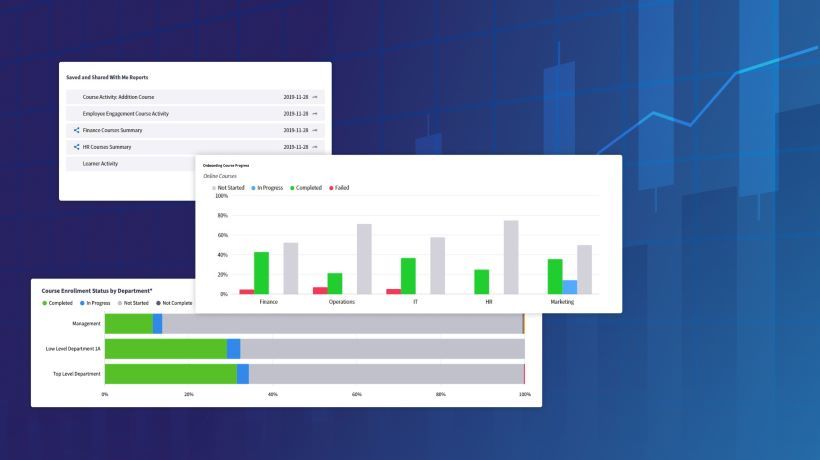
Where are your learning analytics? The data available goes far beyond your LMS. - How to analyze your top-level stats.
What to look at when it comes to visits, completion rates, audience profile, devices, session time and authoring time. - How to analyze eLearning page performance.
Know your popular pages! Why are you losing people? How are different branches performing? - A 3-stage strategy for making data part of your design toolkit.
Discover Lori’s “Diagnose, Respond, Monitor” cycle to embed data driven design into your everyday. - How to analyze question responses and surveys.
Are there killer questions users should be getting right but aren’t? Are your polls and surveys serving their purpose?
As eLearning grows and expands, a digital body language is build up. Whoever can interpret it has an advantage on making a real success story of its eLearning projects. That is why The Everyday Guide To Learning Analytics is a valuable tool, if you care to learn how to analyze the stats and use them to create great digital learning design.
Related articles:
1. Why You Need Learning Analytics In Digital Design
2. How To Conduct Learning Data Analysis To Draw Meaningful Insights