
How To Turn Learning Analytics Into Actionable Outcomes
Some companies that use learning analytics (LA) get off to a strong start with LA, but they forget to close the loop—they collect and analyze data, but they stop there. Effective learning analytics is a cyclical process. Learners generate data that can be analyzed for patterns such as successes, weaknesses, overall personal or comparable performance, and habits. Instructors can administer “interventions” based on the information gathered, and the process then repeats itself. As learners respond to the interventions, new data reveals their progress and instructors continue to adapt their instruction to help students succeed.
Advanced Reporting In Moodle & Totara, With Lambda Zoola
When applied successfully, learning analytics can help answer questions [1] such as:
- When is a student at risk of failing or dropping out?
- Identify gaps in courseware.
- Determine intervention strategies based on analytical data.
- Does a student need extra support on a specific area?
Actionable Learning Analytics
But actionable LA doesn’t just answer these questions—it helps instructors to choose the right interventions. Intuition plays an important role, but learning analytics is an integral tool to helping struggling learners achieve their goals.
There are 4 types of analytics that go into developing actionable LA. All 4 are integral to helping instructors understand how to help students succeed:
- Descriptive.
What happened? Descriptive analytics takes student data and creates dashboards that display meaningful patterns and trends. - Diagnostic.
Why did it happen? Diagnostic analytics seeks to understand the reason for trends and outliers in the data. Why did this one student do poorly on the assessment? Why did the entire cohort miss this question? - Predictive.
What will happen? Predictive analytics uses historical trends and patterns to predict individual students’ success or failure. This allows instructors to identify learners early on who are most likely to fail or drop out. - Prescriptive.
What should I do? Prescriptive analytics aims to provide recommended interventions that the instructor—or the student—can take to improve a student’s chances of success.
A Gartner survey revealed that only 13% of companies use predictive analytics [2], and fewer than 3% use prescriptive analytics. Feedback loops between students and instructors are woefully absent—but you can use learning analytics to change that.
Best Practices On How To Turn Learning Analytics Into Actionable Outcomes
Let’s explore the process of developing actionable learning analytics in an online environment.
1. Gather And Report On Data
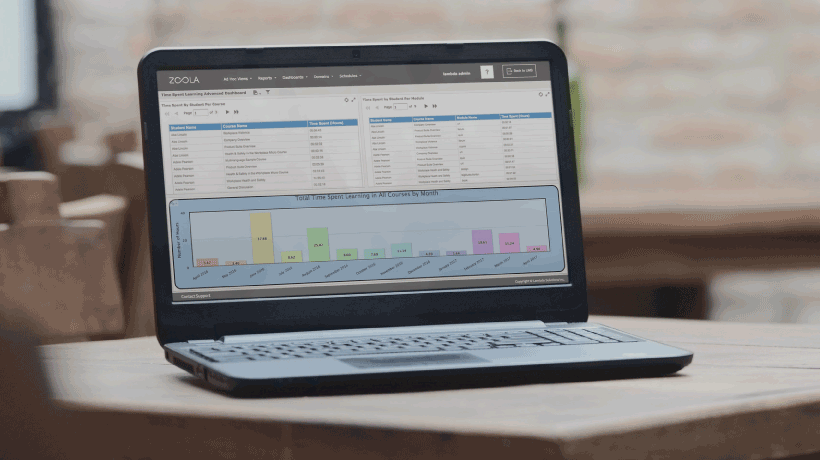
The first step in producing actionable outcomes from learning analytics is to gather the data you need and create reports. Reports can be generated in several different formats, but most people prefer to see data visualizations that make it easy to get a quick understanding of the students that are likely to succeed. There are plenty of tools and Moodle plug-ins [3] that allow you to create visualizations that are easy to understand at a glance—a tremendous benefit, since you may be collecting a lot of data.
The data you collect should be a combination of engagement and performance data—but be sure you’re not collecting information that you won’t use.
Performance assessments should be frequent, and probably short, rather than high-stakes tests that are few and far between. Self-tests of just five questions may be all you and your students need. By taking the pulse of your learners frequently, you’ll get a better picture of their learning success as they move through the online module. You’ll also be able to spot students that are struggling early on, and intervene quickly before it’s too late to help them succeed.
2. Analyze Trends
Your data reports and visualizations will help you to identify historical trends and correlations, which you can use to understand what happened and why. LA software lets you compare a student’s activity with others in the program, with learners who have previously taken the course, and against the module’s rubrics.
In this way, learning analytics capitalizes on the vast quantities of data that your Learning Management System is already collecting to find patterns that can be used to improve learning.
3. Predict Outcomes And Intervene
Once you’ve analyzed trends in the data, the LA software can create a model that predicts how each student is likely to fare. Predictive analytics allows you to anticipate likely scenarios and develop an intervention strategy for each student.
Intervention should be personalized to the learner—based on their engagement data, performance data and any personal information you may have. For example, if you notice that a student stopped participating in online forums just before their performance began to drop, it would be proper to encourage the student to resume their involvement in the forums. At the same time, it could be helpful to get feedback from the student to find out why they stopped participating. There may have been an event in the course or some other obstacle that you should address in order to facilitate the student’s involvement in the online forums.
Often, simple feedback is all that’s required for effective intervention. System-generated interventions can be anything from a simple dashboard alert about a student’s risk of failure to assigning struggling students specific actions to hone their skills. You can provide frequent performance updates, or send basic feedback messages to students about their grasp of the material.
What’s most important in intervention is to make the intervention personalized and timely. Many Learning Management Systems provide tools to help make intervention as simple and trouble-free as possible. Much intervention can even be automated—for example, by providing student dashboards that report up-to-date performance indicators so that learners can self-regulate their own learning experiences and make necessary adjustments on their own.
Effective intervention may involve adapting teaching styles. If your students tend to do better with certain kinds of media, interactivity, or assessments, the course design should be adapted to enable better learning.
Take Action With Your Analytics
Learning analytics can be tremendously valuable to helping online learners become more successful and to assist struggling students early on—but only if you close the loop and turn your LA into actionable outcomes. Don’t just collect the data and produce reports—take learning analytics to the next level by creating actionable outcomes from LA.
Ready to go deeper in your LMS mastery? Check out our upcoming webinars!
References
- Infographic Learning Analytics
- Transform LMS Data into Meaningful Insights in Minutes with Zoola™ Analytics
- Learning Analytics in Education: Using Student’s Big Data to Improve Teaching
Related Articles:
- Free eBook: Advanced Reporting In Moodle & Totara, With Zoola Analytics
- 7 Ethical Concerns With Learning Analytics
- What Sources Of Learning Analytics Should You Be Collecting?
- The Importance Of Learning Analytics In Instructional Design
- Learning Metrics That Matter: Data Points You Should Be Measuring