Which Essential Data Do You Need to Measure eLearning ROI?
This article is part of a series on tracking the right metrics using the right methodology to visually display and quantify the investment in learning and prove ROI. What you are about to read is a fable. The company, AshCom, is fictional, but the learning challenges faced by Kathryn, AshCom’s CLO, and her team are real and commonly shared by learning teams in large organizations. It is our hope that you will be able to connect with the characters, their challenges, and the solutions they discover. We also invite you to read the first eBook in the series.

The Chief Learning Officer's Challenges
Kathryn crumpled old sticky notes and deposited them in her wastebasket. After she straightened two stacks of papers, she placed them in files on her desk. She tore off the top page of her daily calendar. It was a new day.
Kathryn, the Chief Learning Officer of AshCom, faced two challenges. The first came from Kurtis, the Chief Financial Officer of the company. Having lost money in the last quarter for the first time in company history, Kurtis and his finance team were examining every line item in their budget looking for opportunities to lower their expenses. They named their effort “Defend the Spend.” This applied to Kathryn’s learning team. Kathryn knew that learning was notoriously weak in demonstrating learning return on investment. AshCom’s sales, operation, and human resource teams were all able to show impressive ROI statistics on well-designed dashboards that gave the financial team’s performance results in real time.
The learning team did not have anything comparable. This caused Kathryn significant stress, especially when budget cuts were on the table for everyone in the organization.
Kurtis asked Kathryn and her team to build a set of new learning experiences focused on preventative maintenance. As Kurtis examined expenditures and performance, he quickly realized that AshCom was losing a lot of money because its machinery was not being properly maintained before problems became obvious. Machines were down far more for repairs than they should have been. Parts produced per hour goals were not being achieved. Scrap rates were soaring. All this was related to a lack of a solid preventive maintenance program.
Building The ROL System
Kurtis combined this immediate need with a return-on-learning system he was asking Kathryn to build. Kurtis did not require a system for tracking the impact of all learning at this moment. That would come later. For now, Kathryn’s team would be expected to build new preventative maintenance training while also building a system that would demonstrate how learning improved performance.
Kathryn was driving to track learning impact by a second factor, more internal and related to her desire for continuous improvement. She wanted her team to understand how their learning experiences were functioning for learners. Too often, she believed that her team simply moved on to build the next set of learning without looking back at what was working and what was not.
To meet both goals, Kathryn set up a series of meetings with Amy, a trusted learning consultant to the learning team. Amy brought more than 20 years of experience in learning as both an instructional designer and a consultant to some of the largest companies in the United States.
Amy set a schedule to dive deep into what needed to be considered when building an impact learning structure. They began with a review of Kirkpatrick’s Model for levels of evaluation and added a fifth level that included the learning team’s thoughts about the experiences they were creating.
Amy showed Kathryn how The Learning Scorecard software from MindSpring was able to gather the data and properly weight it. Not every metric was equally important and so each data point at every level was weighted, which provided a net score.
What was needed next was a dashboard to show results in real time. Kathryn knew that her reports to the finance and operations team would not be effective if they consisted of page after page of spreadsheets. She needed a dashboard that would demonstrate impact at a glance and that would match the features of those used by AshCom’s sales, operations, human resources, and marketing teams.
The Breakfast Meeting
An overview of dashboards was the topic of the next breakfast meeting between Kathryn and Amy.
“I’ve given this some thought,” said Kathryn at the start of the meeting, “and I think I know what I want to be included on our learning dashboard.”
Amy smiled. “Well, like my grandfather used to say, ‘Let me say this about that.’ We need to slow down a little and talk about what dashboards are and why they can be so useful to business leaders.”
“I probably should have anticipated that,” said Kathryn returning the smile. “I am under a lot of pressure to get this done.”
“I know you are,” replied Amy. “We won’t take a lot of time, but we really do need to think through every step of this.”
“I’ll follow your lead,” said Kathryn with a slight hint of impatience.
“I appreciate your trust,” said Amy. “Let’s talk about the why of dashboards. People like your CEO, CFO, and COO have to make countless business decisions every month. Their ability to make the correct decisions is directly connected to the amount of information they have available to them. They need to see what is working and what is not working. They are constantly choosing where to spend resources to give them the best business outcomes. Bad decisions are most often caused by bad information.”
“And that has to happen quickly,” said Kathryn. “I get that. They can’t spend an enormous amount of time digging into every piece of information they need. They rely on people like me and other leaders here to provide that information.”
“Exactly,” said Amy. “They need the right data, and they need it quickly. Most learning teams I work with have a difficult time providing the data decision-makers want in the time they want it.”
Gathering The ROI Stats
“That’s why I am stressed by this process,” said Kathryn. “I do not have a great track record on this. My reports are usually about how many people took the training and how they did on knowledge checks. I know this is a long way from the ROI stats they want, but that’s about all I have most of the time.
“That’s why we are going through this exercise,” said Amy. “Don’t overlook the benefits of having a dashboard for you and your team, though. You can learn a lot about what is working, what is not working, and what you want to do differently next time.”
“That is a concern,” said Kathryn. “I’m not sure a dashboard that is meaningful to our CFO will be all that beneficial to my learning team.”
“You bring up an excellent point,” said Amy. “There are different kinds of dashboards. Some are tactical, for use with people like you and others in management. Others are strategic dashboards that are used by people like your CFO and COO. Still others are operational dashboards that would be used by both you and your team to make their learning more efficient and continuously improve.”
“Does this mean that we need three separate systems?” asked Kathryn. “I think this just got a lot more complicated.”
“It doesn’t have to be,” said Amy. “Ideally your system is gathering, weighting, and tracking all the data you need for each dashboard. The only difference is that the dashboard pulls different metrics for each specific audience. That’s why I’m recommending The Learning Scorecard. You can customize multiple dashboards to meet your needs.”
“That would make things a lot easier,” said Kathryn.
Going Beyond The Quantitative Data
“I want to add another thing to consider,” said Amy. “People hear ‘dashboard,’ and they think they can only report numbers. In other words, dashboards are only good for reporting quantitative information.”
“That would be a shame,” said Kathryn. “I’ll admit that we usually report mostly qualitative data—things like success stories and testimonials. They don’t provide the return on investment like our CFO would like to see, but they are an important part of what is actually happening in learning.”
“I completely agree,” said Amy. “You don’t want to lose that. The Learning Scorecard has a feature that allows these stories and testimonials to be part of the overall narrative for every audience. The ideal mix is both qualitative and quantitative. Numbers for numbers people, and stories for story people.”
“I like that,” said Kathryn.
“One more piece of advice on dashboards,” said Amy. “Make sure you get clarity with each audience on what kind of dashboard they want. It will be worth an hour spent with Kurtis the CFO to determine what he would like to see in his version. You will have to think about what you want to see and also what your team would like to see in theirs.”
“So, we need different levels of access?” asked Kathryn.
“For sure,” said Amy. “Or at least logins that take people to the correct version. I’m not sure if any of your learning results might need to be confidential, but that should be clarified with Kurtis before you launch anything.”
“I’m feeling even more optimistic,” said Kathryn. “For the preventative maintenance learning, we have identified what we want to measure and how we intend to measure it. We know what our model will be, and we have a way to make the results visible to various audiences inside AshCom.”
“That was the objective,” said Amy. “I’ve created a demo dashboard in The Learning Scorecard that I thought might be useful to you.”
“Of course you did,” replied Kathryn. “I really appreciate how you’ve led me through all this.”
“You will really like our next session,” said Amy. “We are going to look at how The Learning Scorecard can not only tell you how your learning is functioning, but it can also help you predict how well new learning products will work in the future. You and your team will love it.”
“We’ve mostly gone on instinct and some ancillary data points to decide what to do next,” said Kathryn. “It would be nice to have something stronger on which to base our decisions.”
“Experience, intuition, and stories are all still part of deciding what types of learning experiences are connecting with your learners,” said Amy. “But this will be a powerful tool for you and your team.”
“I look forward to that conversation,” said Kathryn as Amy stood to leave. “Until next time.”
“Until next time,” said Amy smiling. “I will see you in a few days.”
Conclusion
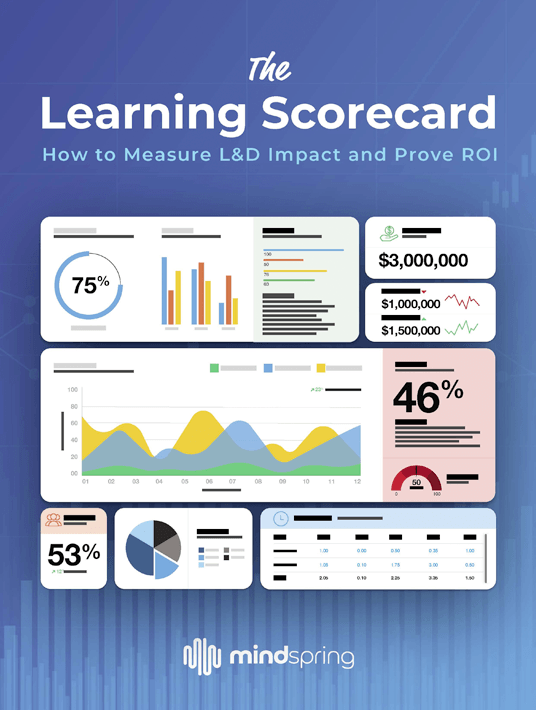
Download the eBook The Learning Scorecard: How To Measure L&D Impact And Prove ROI to delve into the data and discover which key metrics your L&D team should consider. You can also join the webinar to discover a completely new approach to measuring ROI.
Dear Reader, if you would like to see a demo of MindSpring’s Learning Scorecard, please click here to schedule a time convenient for you and the learning experts at MindSpring will be happy to walk you through it.


