How To Use eLearning Infographics To Improve Knowledge Retention
In today’s busy, tech-centered world, the need to gain knowledge is unparalleled. The irony is that everyone nowadays is too busy to find the time to learn. That’s where eLearning comes in. Online learners opt for an eLearning course because it is the quickest and most convenient way to gain knowledge. However, eLearning is of no value to online learners if they are unable to remember the key takeaways. Here are 7 useful tips to help you improve knowledge retention with eLearning infographics.
Why Use eLearning Infographics?
Before we look at our knowledge retention tips, we want to explain why infographics are the tool that you should be using for spreading knowledge. Infographics are an excellent visual tool that helps learners retain information for longer periods of time. This is because infographics combine text, graphics, illustrations, icons, graphs, and charts into one cohesive and comprehensive visual.
This particular graphical form became popular in the content marketing sphere in 2010, but educators were able to find eLearning applications for the format in other areas. Educators were better able to leverage the knowledge sharing aspect of infographics with the rise of infographic template websites that made the creation and distribution of infographics much easier. With a host of attractive infographic templates to customize to the needs of learners, educators were placed in a strong position to stimulate the cognitive learning of online students and employees.
Having created eLearning infographics, here are 7 tips for improving knowledge retention.

1. Transfer Knowledge In Bits And Pieces
Overloading online learners with knowledge will diminish the value of your eLearning course. In fact, cognitive overload is an eLearning professional’s nemesis, as it wreaks havoc on human memory. It is important for educators and employers to remember that the changing digital sphere has led to less overall retention—not only with regard to knowledge and learning but also in the leisure arena. People simply do not have the time to engage with all the text and imagery they come across on a daily basis—either through social media, advertising, or via learning tools.
This is why information should be provided in small doses. Design your eLearning infographics in such a way that allows your online learners to absorb each piece of information before moving on to the next step. Once they digest a single idea or concept, they will find it easy to understand the next one.
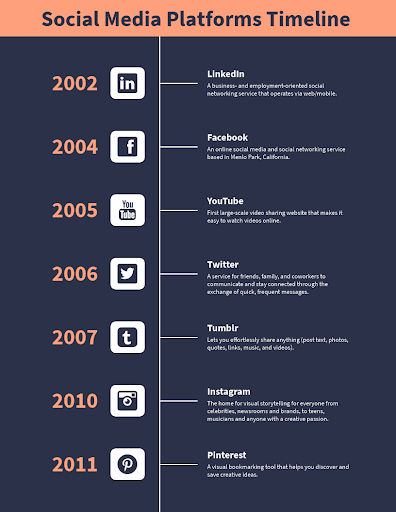
Look at the layout of this simple but effective timeline infographic about social media platforms.

It very clearly designates each year with a platform with a short snippet of information about the channel. The layout is user-friendly, ensuring the eye moves down, but can also absorb the bigger picture at a glance. Such infographic layouts, and the condensed information they contain make it easier for the learner to view the information and understand it. Consequently, they will feel more confident and self-assured, which further enhances the benefits of your eLearning course. Look at the layout of this simple but effective timeline infographic about social media platforms.
2. Only Present Data That You Want Online Learners To Remember
Relevancy is another key point you should keep in mind when designing your eLearning infographics. Only include data that is relevant to the subject matter. Try to keep the text precise and concise. This way, online learners will maintain their mental focus and absorb the facts and stats. Not to mention, they won’t waste precious time on topics that won’t matter in the long run.
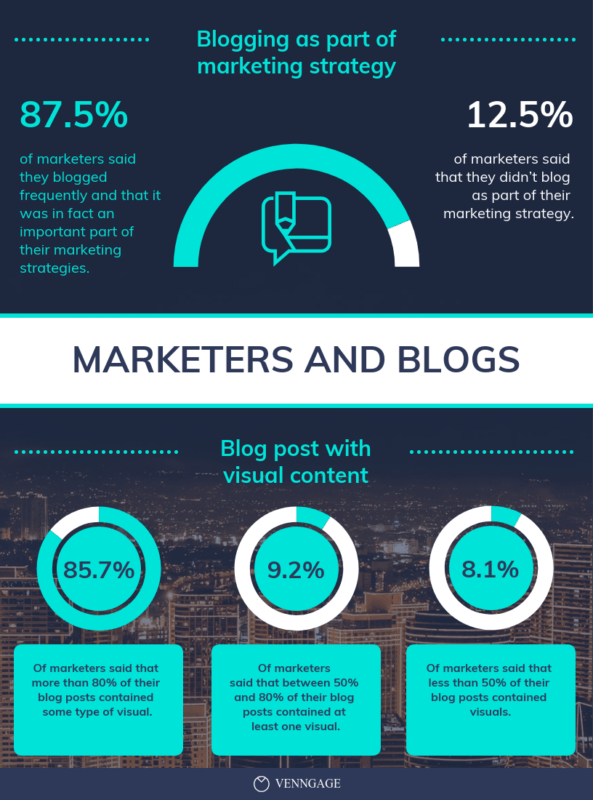
For example, look at the marketing strategy infographic below:

The infographic narrows down the focus of a marketing strategy—from traditional marketing, digital marketing, advertising, etc—to matters pertaining only to blogs. For content marketers currently working on improving their blog reach, this is the data that is more important to them. Including a holistic view on marketing, in this case, will have very little impact on the learner. In fact, it could have the opposite effect of making the learner forget what they are trying to retain.
Before you publish your eLearning infographic, evaluate each piece of data and weigh its relevance. Does it really support the subject matter, or will it just lead to learner confusion? If you’re unsure about what information to include, meet with your Subject Matter Expert to narrow down the discussion points. They’ll be able to tell you which facts and figures your online learners need and which can go by the wayside.
3. Repetition Is The Mother Of Learning - Make Use Of It
Repetition is one of the most powerful ways of knowledge retention. If not done properly, repetition results in monotony and boredom causing online learners to lose interest. Thus, you have to be creative with repetition, and eLearning infographics offer you the power to do so. You can present the same information in completely different ways. For instance, stats can be transformed into a graph, pie-chart, or a 5-point list that features compelling images.
There are a number of benefits to using compelling data visualization techniques to impress facts upon the learner. Put yourself in the learner’s shoes—would you want to read an entire paragraph about a dataset? Would that help you retain what you have learned, or would the numbers all become a jumble in your head?
The traditional method of writing paragraphs of text about data is unlikely to encourage learners to engage with the text. Instead, it could prompt them to want to move on to the next topic as quickly as possible—employees have so much on their mind already, after all. It is highly unlikely that they will retain anything from the topic at hand if all you have to offer are large blocks of text.
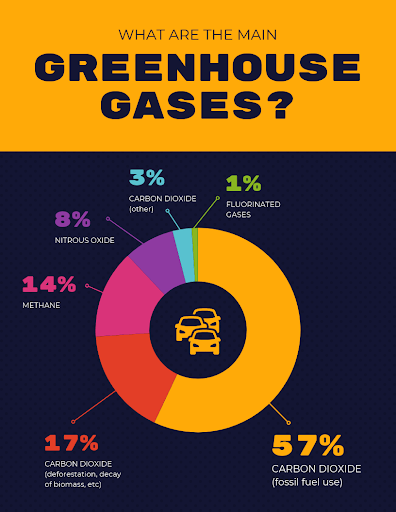
To ensure that learners engage with the topic more completely, you need to tap into more than just the learning and logical center of the left hemisphere of the brain—you need to activate the creative and visual side of the brain, located in the right hemisphere, for a more comprehensive understanding of the facts you are presenting, like in the chart example below.

The best way to do this is by creating sets of visually appealing charts and graphs that give context to the data, either through icons or illustrations.
If you are wondering why charts and graphs are so effective in knowledge retention, it is because of how they organize data into easy-to-absorb categories. Charts also create relationships between data points that would otherwise be hard to decipher. Additionally, charts help you compare and contrast changes in information over a period of time.
When you are making an eLearning infographic, choose a data visualization chart template that will succinctly showcase your points while also being memorable for the learner. These charts will be more attractive and interactive for learners, ensuring that they better retain what they have learned from your eLearning infographic.
4. Include Branching Scenarios And Simulations That Online Learners Can Relate To
Include features in your eLearning infographics that push online learners to reach the conclusions themselves. For example, provide different decision paths for a single situation, then give them the opportunity to explore the consequences of each choice. You should provide them with the freedom to experiment. This flexibility empowers online learners to put their knowledge into practice. The use of prior knowledge also allows them to capitalize on their existing mental schema. In eLearning infographics, you can use flow diagrams to present your data. Using real-life scenarios is the key, as this gives employees the chance to contextualize the information. The beauty of eLearning infographics is that you can incorporate links. As such, the sky is the limit when it comes to interactive online training resources that tie facts to work-related challenges.
5. Conduct Follow-Up eLearning Assessments
For more involved subject matters, consider a follow-up eLearning assessment after each eLearning infographic. This practice has two purposes: Firstly, after every eLearning assessment the online learner will have the chance to evaluate themselves regarding their level of understanding. This will give them the time to work on areas for personal improvement before proceeding further. As a result, they can build up advanced knowledge and improve memory retention. Secondly, this eLearning activity will engage online learners and keep them actively involved. Keeping online learners interested is a great way of ensuring that they are receiving knowledge with an open mind.
6. Add eLearning Infographics To Your "Moment Of Need" Library
eLearning infographics are one of the most effective just-in-time online training tools at your disposal. They are easily digestible and quick to consume. Therefore, online learners can get the targeted information they need whenever, wherever. In a business setting, the trick is to align each corporate eLearning infographic with a work-related task or performance issue. For example, a corporate eLearning infographic may center on how to successfully complete the sales process using the POS, or troubleshooting a software issue with a client over the phone.
Most businesses have a shared server where important files and user onboarding manuals are stored. Why not include your eLearning infographics in a separate folder on the server? This will make the infographics easily accessible for anyone who needs it. Remember how we mentioned the importance of repetition above? Simply showing employees the infographics once during a seminar won’t always be enough for them to retain what they have learned. Give them access to the course materials so they can dip in and out of them when they need to, and they always have a reference point to turn to if they have any questions.
7. Include Thought-Provoking Images
Online learners are more likely to remember information if it forms an emotional connection. For instance, thought-provoking images that help them relate to the topic and leave a lasting impression. Their minds will automatically tie these images to the facts and stats you want to convey, like in the infographic about personality types below.

The above infographic packs in a large amount of information alongside confusing acronyms. But because of the imagery associated with each acronym and category, it will be far easier for the learner to absorb what they have encountered in the infographic. Additionally, they are likely to identify with one or other of the personality types featured in the imagery, which will further improve retention.
Thus, they’ll lock it away in their long-term memory for later use. Keep in mind that your eLearning infographic visuals should never blur the line between provoking and offensive. This is yet another reason why you should research your target audience to disclose their backgrounds.
Conclusion
Knowledge retention in businesses is extremely important—especially considering that high turnover rates means that essential information held by a handful of staff members is being lost. For new employees, it isn’t possible to know everything about the company the moment they take on a role. This is why eLearning is so necessary for onboarding new employees as well as teaching existing employees new methods and technologies.
Apply these 7 tips and make the knowledge stick by using eLearning infographics. Long-term knowledge retention yields a variety of benefits. Corporate learners are more satisfied with their jobs, which reduces employee turnover rates. They also enhance the effectiveness of your corporate eLearning program, thereby improving ROI. eLearning infographics may not be comprehensive online training resources that cover every aspect of the topic. However, they are a highly engaging and memorable aid that can improve memory retention.
Do you want to create amazing eLearning infographics for your eLearning course? Download our free eBook The Ultimate Guide To eLearning Infographics to discover how to work with eLearning Infographic templates, the benefits of including eLearning Infographics into your eLearning course design, the steps you should follow to create them, as well as examples of creative uses and must-have features that exceptional eLearning Infographics typically include.


