

Benchmarking Matters More Than You Think
B2B marketing benchmarks give meaning to your results. Marketing performance means little without context because every industry, audience, and sales cycle comes with different expectations. For example, a 3% conversion rate might signal excellent performance for one company but leave plenty of room for improvement for another. The same applies to cost per lead. Spending $200 to acquire a lead could deliver an excellent return if those prospects convert into high-value customers. On the other hand, it could point to an inefficient campaign if revenue fails to justify the investment. According to Gartner, the average B2B buying group now involves six to ten decision-makers, making it more important than ever to measure performance against reliable standards instead of relying on assumptions.
That's why benchmarking plays such an important role in modern B2B marketing. When you compare your results with industry averages, you gain a clearer understanding of where your strategy succeeds and where it falls short. Instead of looking at individual marketing performance metrics in isolation, you can evaluate how every stage of your marketing efforts contributes to business growth. From funnel conversion and lead quality to customer acquisition costs and pipeline velocity, benchmarks help you prioritize improvements that have the greatest impact on revenue.
In this guide, you'll discover the most important B2B marketing benchmarks for 2026 and learn how to interpret them with confidence. We'll explore the KPIs that matter most to CMOs, Marketing Directors, Demand Generation Managers, and Growth Leaders, while also highlighting learning tech benchmarks and other SaaS-focused insights where relevant. Whether you're reviewing quarterly performance or planning next year's budget, these benchmarks will help you make smarter decisions backed by real performance data.
Key Takeaways
- Benchmarks provide context, not absolute targets.
- Conversion rates, CPL, CAC, pipeline velocity, and branded demand should be measured together.
- The best-performing B2B companies balance efficiency with long-term brand investment.
- AI visibility and Share of Voice are becoming important modern marketing benchmarks.

In This Guide, You Will Find...
- Why Benchmarks Matter
- The Core B2B Marketing Metrics Every Team Should Track
- Conversion Rate Benchmarks
- Cost Per Lead (CPL) Benchmarks
- Customer Acquisition Benchmarks
- Pipeline Metrics That Matter
- Brand Metrics That High-Performing Companies Track
- The New Benchmarks: SEO, GEO & AI Visibility
- Benchmarking By Company Stage
- How To Build Your Own Benchmark Dashboard
- Common Benchmarking Mistakes
- The Future Of B2B Marketing Measurement
- eLearning Industry Benchmarks
Why B2B Marketing Benchmarks Matter
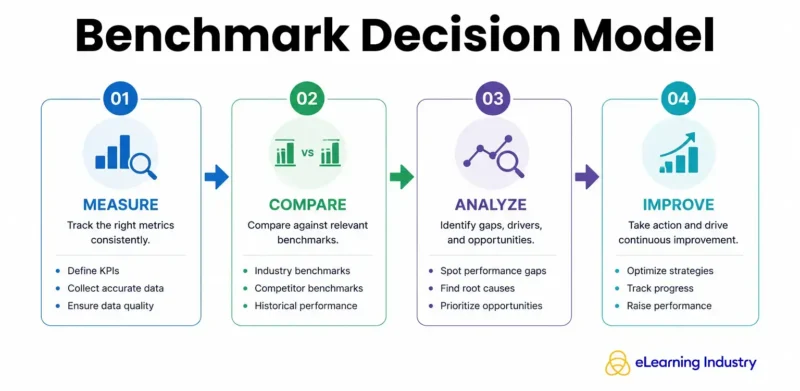
Tracking marketing results helps you understand what happened, but benchmarks show you whether those results actually matter. Without a reference point, even strong numbers can create a false sense of confidence. B2B marketing benchmarks give you the context needed to evaluate performance, communicate results to leadership, and make smarter decisions about future investments.
-
Create Better Context Around Performance
A metric only tells part of the story. For example, generating 500 leads in a quarter might sound impressive, but the real question is whether those leads match your target audience and contribute to revenue. Comparing your results with industry standards helps you understand if your current approach performs well or requires improvement.
-
Improve Executive Reporting
CMOs and marketing leaders need to show how marketing activities support business goals. Instead of presenting isolated numbers, benchmarks help you explain performance with meaningful comparisons. Your marketing KPIs become easier to understand when you can show how they compare with similar companies, previous periods, or industry expectations.
-
Support Smarter Budgeting Decisions
Marketing budgets often depend on proving efficiency. Benchmarks help you identify whether your spending delivers competitive results or whether certain channels require adjustments. For example, understanding how your CPL compares with average B2B conversion rates in 2026 can help you decide where to increase investment and where to reduce unnecessary costs.
-
Improve Forecasting Accuracy
Reliable benchmarks allow you to create more realistic growth predictions. When you understand expected conversion rates, acquisition costs, and sales outcomes, you can build forecasts based on realistic assumptions instead of optimistic estimates.
-
Find Opportunities For Optimization
Benchmarking helps you discover gaps across your funnel. If your lead volume looks healthy but revenue growth remains slow, the problem may come from lead quality, sales alignment, or inefficient processes. Using benchmarks as part of your strategy creates a stronger foundation for data-driven growth.
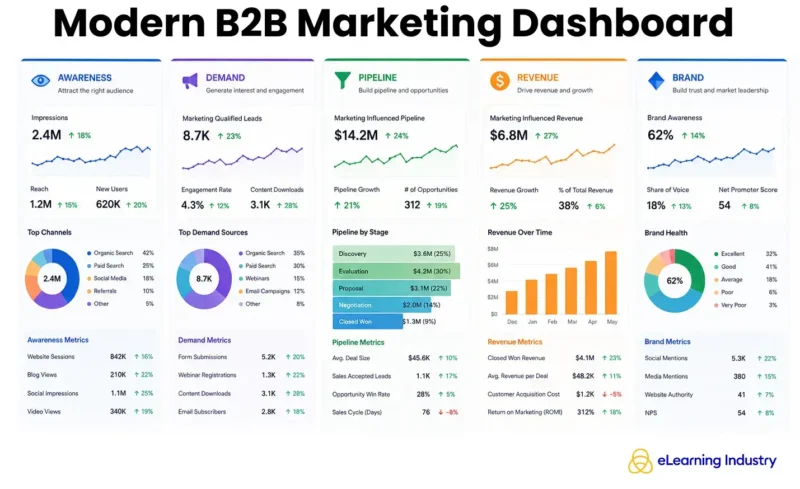
The Core B2B Marketing Metrics Every Team Should Track
-
Website Traffic
Website traffic shows how effectively your marketing channels attract potential buyers. However, traffic volume alone does not determine success. You need to analyze where visitors come from, which pages they view, and whether they take meaningful actions. High-quality traffic from relevant audiences usually creates stronger opportunities than large numbers of visitors with low purchase intent.
-
Marketing Qualified Leads (MQLs)
An MQL represents a prospect who matches your ideal customer profile and shows enough interest to continue the buying journey. Tracking MQL volume is among the most crucial B2B marketing benchmarks, as it helps you understand whether your campaigns attract the right audience. However, quality matters more than quantity, as a large number of unqualified leads can increase costs without improving revenue.
-
Sales Qualified Leads (SQLs)
An SQL shows that a prospect has moved further through the funnel and meets sales readiness criteria. Monitoring SQL generation helps marketing teams measure how effectively they support sales teams with valuable opportunities. Comparing MQL-to-SQL conversion rates can reveal whether your targeting, messaging, and lead nurturing strategies work effectively.
-
Opportunities
Opportunities indicate how many qualified prospects have entered active sales conversations. This metric connects marketing activities with potential revenue outcomes. When you evaluate opportunities alongside your SaaS marketing benchmarks, you can better understand whether your campaigns create enough demand to support business growth.
-
Pipeline Contribution
Pipeline measures the potential revenue created through marketing-generated opportunities. Many B2B teams focus on this metric because it shows the direct business impact of marketing efforts. Tracking pipeline sources also helps you identify which channels create the strongest commercial results and improve revenue marketing strategies.
-
Pipeline Velocity
Pipeline velocity measures how quickly prospects move through your sales funnel. For companies operating in specialized industries, understanding pipeline velocity in learning tech can help identify delays in long sales cycles and improve forecasting accuracy.
-
Revenue Generated
Revenue remains one of the most important indicators of marketing effectiveness. Modern marketing teams need to connect campaigns with closed deals, customer value, and long-term business growth. These insights support the marketing metrics every CMO should track when evaluating overall performance.
-
Customer Acquisition Cost (CAC)
CAC shows how much your business spends to acquire a new customer. Comparing acquisition costs with customer lifetime value helps you determine whether your growth model remains sustainable.
-
Cost Per Lead (CPL)
CPL measures the average cost of generating a new lead. Tracking this metric across channels helps you understand which campaigns deliver the best balance between spending and lead quality. It is undoubtedly one of the most important B2B marketing benchmarks.
-
Return On Ad Spend (ROAS)
ROAS evaluates how much revenue your paid campaigns generate compared to your advertising investment. It helps teams optimize paid media budgets and identify the channels that create the strongest returns.
-
Brand Metrics
Brand awareness indicators, including branded search volume, Share of Voice, and audience engagement, show how your visibility changes over time. These metrics help you measure demand creation beyond immediate conversions and understand how your marketing efforts influence future buying decisions.
Conversion Rate Benchmarks
-
Landing Pages
Landing page performance depends on factors such as message clarity, page design, audience intent, and the value of your offer. Pages created for specific industries, use cases, or buyer segments often generate stronger results because they speak directly to customer needs. So, to optimize landing pages for higher conversion rates, use clear headlines, strong calls-to-action, customer testimonials, and shorter forms. However, a high conversion rate does not always mean success if the page attracts visitors who are unlikely to become customers.
-
Webinar Registrations
Webinar registration performance depends on the topic, speaker authority, promotional channels, and audience relevance. A webinar focused on a specific challenge usually attracts more qualified attendees than a broad educational session. Timing also plays an important role, as promoting too early or too late can affect registration numbers. Companies should evaluate registration quality alongside attendance rates and post-webinar engagement.
-
Content Downloads
Content offers such as reports, guides, and templates perform best when they address a clear business challenge. A detailed resource that helps buyers solve a specific problem will usually outperform generic content. Your audience targeting, landing page experience, and follow-up process all influence how effectively downloads contribute to lead generation.
-
Demo Requests
Demo requests usually indicate stronger purchase intent because prospects are actively evaluating solutions. However, performance depends on your product positioning, website experience, pricing information, and trust signals. Companies with a clear value proposition often achieve stronger B2B conversion rates because buyers quickly understand how the solution can help them.
-
Free Trials
Free trial conversions depend on product usability, onboarding quality, and how quickly users experience value. Reducing signup friction and guiding users toward important product actions can improve results. SaaS companies should analyze both trial registrations and the percentage of users who become paying customers.
-
Email And Paid Search
Email conversion rates depend on list quality, segmentation, personalization, and campaign timing. Paid search performance relies on keyword intent, competition, ad relevance, and landing page alignment. These channels directly impact funnel conversion by helping prospects move from initial interest to meaningful actions.
-
Overall Conversion Performance
Conversion benchmarks should always be viewed within your market context. B2B marketing benchmarks differ based on audience, industry, buying complexity, and sales cycles. Strong results come from aligning campaigns with customer expectations and maintaining a consistent brand strategy across every touchpoint.
Cost Per Lead (CPL) Benchmarks
-
Search Campaigns
Search advertising often generates new leads with strong purchase intent because users actively search for solutions. However, CPL changes depending on keyword competition, industry demand, targeting settings, and landing page performance. High-intent keywords usually come with higher costs, but they can attract prospects who are already closer to making a purchase decision. When comparing B2B CPL benchmarks, you should look at both the cost of acquiring a lead and the quality of the opportunities those leads create.
-
LinkedIn Campaigns
LinkedIn campaigns often have a higher CPL because they allow marketers to target specific professional audiences, including job titles, industries, company sizes, and seniority levels. For B2B companies, paying more for a lead can still make sense if those contacts match the ideal customer profile and have a stronger chance of becoming qualified prospects.
-
Content Syndication
Content syndication platforms helps companies distribute resources through external platforms, industry websites, and partner networks. Lead costs depend on audience targeting, content relevance, and the level of engagement behind each download. A highly interested prospect who reads a detailed report or guide can provide more value than multiple low-intent contacts.
-
Webinars
Webinars usually require more resources because they involve planning, promotion, speakers, and production. However, they often attract engaged audiences who actively want to learn about a specific topic. Measuring attendance, participation, and post-webinar interactions gives you a better understanding of lead quality than registration numbers alone.
-
Events
Events often create some of the highest acquisition costs due to sponsorship fees, travel, and operational expenses. However, they can be valuable for building relationships and accelerating sales conversations. For businesses with complex products, a single strong opportunity from an event can justify the investment.
-
Organic Channels
Organic search and content marketing may appear cheaper because they do not require direct advertising spend. However, they require ongoing investment in content creation, SEO, and optimization. Many companies use organic channels as part of a full-funnel marketing strategy to attract prospects at different stages of the buying journey.
-
Referrals
Referral leads often deliver strong results because they come with existing trust and credibility. Although they may not always look competitive in traditional B2B cost per lead benchmarks, they often generate higher-quality conversations and stronger conversion potential.
-
Evaluating Lead Quality
B2B marketing benchmarks help you compare CPL across channels, but the lowest cost does not always represent the best outcome. A cheap lead that never becomes an opportunity can waste resources, while a more expensive lead that turns into a high-value customer can create significant business impact. Companies should evaluate CPL alongside conversion rates, customer value, and sales outcomes instead of focusing only on reducing acquisition costs.
Do you want to stay updated regarding the latest eLearning news? Subscribe to our newsletter and never miss a beat!
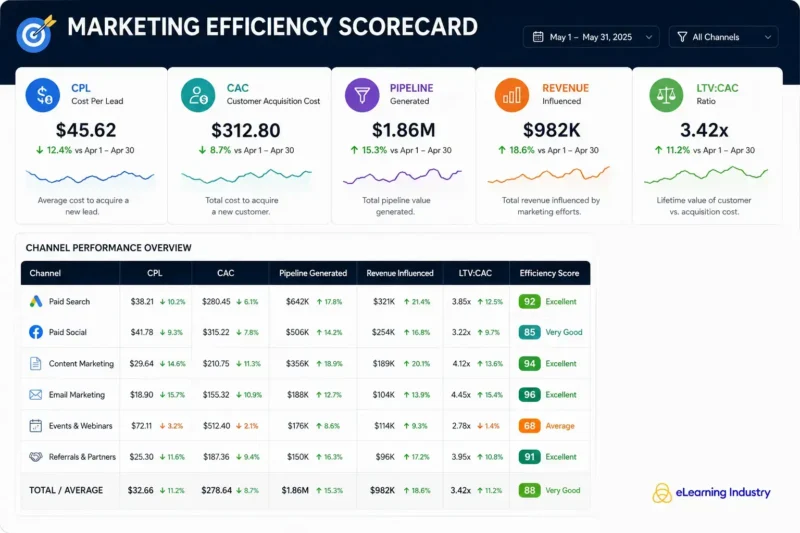
Customer Acquisition Benchmarks
-
Customer Acquisition Cost (CAC)
Customer acquisition cost shows how much your business spends to gain a new customer, including marketing and sales expenses. For executive teams, this metric helps evaluate whether growth remains financially sustainable. A rising CAC may indicate increasing competition, inefficient campaigns, weak targeting, or longer sales cycles. Reviewing CAC alongside revenue growth gives leaders a clearer view of acquisition efficiency and helps them adjust their investment priorities.
-
CAC Payback
CAC payback measures how long it takes for your company to recover the investment made to acquire a customer. Shorter payback periods usually improve cash flow and allow businesses to reinvest in new growth opportunities faster. Executives should monitor this metric closely when scaling campaigns, entering new markets, or increasing customer acquisition spending.
-
LTV:CAC Ratio
The relationship between customer lifetime value and acquisition costs shows whether your growth model creates sustainable returns. A healthy LTV:CAC ratio indicates that customers generate enough value to support acquisition investments. However, leaders should also consider retention rates, expansion revenue, and customer satisfaction before making decisions based only on this ratio.
-
Sales Cycle Length
Sales cycle length affects forecasting accuracy, revenue planning, and team efficiency. Enterprise B2B companies often experience longer cycles because multiple stakeholders participate in purchasing decisions. By connecting sales cycle data with demand generation metrics, executives can identify bottlenecks and improve how marketing and sales teams support buyers throughout the journey.
-
Executive Evaluation
Customer acquisition benchmarks provide a clearer view of whether your customer acquisition strategy creates profitable growth. Looking at acquisition costs, payback periods, customer value, and sales timelines together allows leadership teams to make more informed decisions about budgets, resources, and growth priorities.
Pipeline Metrics That Matter
-
MQL → SQL Conversion
The transition from Marketing Qualified Leads (MQLs) to Sales Qualified Leads (SQLs) shows how effectively marketing attracts and prepares potential buyers. A low conversion rate may indicate issues with targeting, lead quality, messaging, or alignment between marketing and sales teams. Tracking this stage helps you understand whether your campaigns generate contacts that sales teams can actively pursue.
-
SQL → Opportunity Conversion
The movement from SQLs to opportunities shows whether sales teams find real business potential within the leads marketing provides. This metric depends on factors such as buyer intent, qualification criteria, sales follow-up speed, and product-market fit. Companies using marketing benchmarks for SaaS companies often compare this stage to identify whether their lead generation process creates enough valuable opportunities.
-
Opportunity → Closed Won Conversion
This conversion rate measures how many sales opportunities become paying customers. A lower rate may point to pricing challenges, competitive pressure, unclear value propositions, or gaps in the sales process. Reviewing this metric helps executives understand whether the pipeline contains genuine buying opportunities or prospects that require better qualification.
-
Pipeline Velocity
Pipeline velocity measures how quickly opportunities move through the sales process and generate revenue. It combines factors such as deal volume, average deal size, win rate, and sales cycle length. Improving pipeline movement helps businesses forecast revenue more accurately and identify areas where prospects experience delays.
-
Win Rate
Win rate shows the percentage of opportunities that result in closed deals. A strong win rate usually reflects effective positioning, sales execution, and strong alignment between marketing and sales. Reviewing these metrics together provides a clearer understanding of your revenue performance and supports better sales pipeline management decisions. These insights also help teams interpret B2B marketing benchmarks with more accuracy.
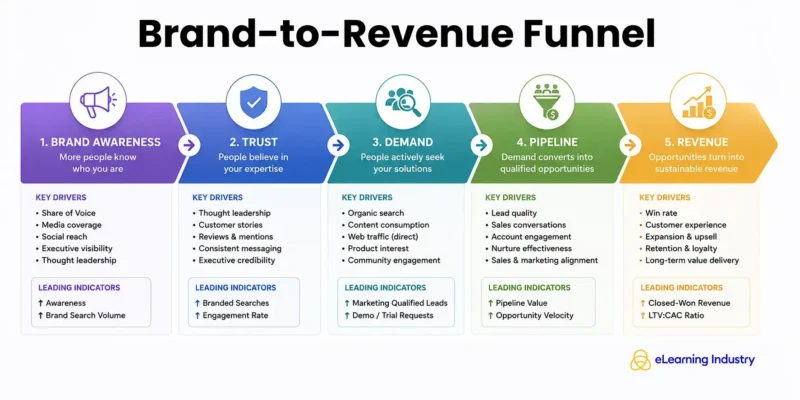
Brand Metrics That High-Performing Companies Track
-
Share Of Voice
Share of Voice measures how visible your brand is compared to competitors across search engines, media outlets, social platforms, and industry conversations. Tracking share of voice SEO helps you understand whether your content reaches potential buyers before they discover competing solutions. A growing Share of Voice often indicates stronger brand awareness and increased market presence over time.
-
Branded Search Volume
Branded search volume shows how many people actively search for your company, products, or services. An increase usually reflects stronger brand recognition and growing buyer interest. This metric also helps you evaluate whether campaigns, product launches, or PR activities encourage more prospects to look specifically for your business instead of searching for generic solutions.
-
Direct Traffic
Direct traffic measures how many visitors access your website by entering your URL or using saved bookmarks. Although not every direct visit comes from existing brand awareness, consistent growth often signals that more buyers already know your company before beginning their purchasing journey. High-performing businesses monitor this metric alongside other acquisition channels to understand how brand familiarity develops over time.
-
Brand Mentions And Media Coverage
Brand mentions across industry publications, podcasts, newsletters, and social media reveal how often people discuss your business. Media coverage extends your reach beyond your own channels and strengthens credibility with potential buyers. Companies that regularly earn visibility through respected publications often build trust long before prospects request a demo or contact sales.
-
Executive Visibility
Buyers increasingly evaluate the people behind a business, not just the product itself. Executives who share industry insights, participate in conferences, contribute articles, or appear on podcasts help strengthen brand credibility. Their visibility can influence purchasing decisions, especially in competitive B2B markets where trust plays a major role.
-
Thought Leadership Engagement
Measuring how audiences engage with research reports, webinars, LinkedIn posts, podcasts, and expert articles helps you understand whether your content builds authority. Strong B2B thought leadership encourages conversations, attracts qualified prospects, and supports long-term demand generation. Many organizations include these indicators in their marketing dashboard KPIs because they provide a broader view of brand performance beyond leads and revenue. When combined with B2B marketing benchmarks, these metrics help executives evaluate both market visibility and business growth.
The New B2B Marketing Benchmarks: SEO, GEO & AI Visibility
Search behavior continues to evolve, and marketing teams need to measure more than rankings and website traffic. Modern buyers discover brands through search engines, AI assistants, and answer engines, which means your dashboards should evolve as well. Alongside traditional B2B marketing metrics, businesses should monitor organic Share of Voice, topical authority, AI citations, AI recommendations, AI referral traffic, and zero-click visibility.
Organic Share of Voice shows how often your content appears for important industry topics compared to competitors. If you're wondering what is share of voice, think of it as a way to measure your brand's visibility across search results instead of focusing on a handful of keywords. At the same time, topical authority helps you understand whether search engines recognize your website as a trusted source on a specific subject.
Another important metric is AI visibility. AI-powered search experiences increasingly recommend content directly to users, making AI citations and recommendations valuable indicators of brand authority. You should also monitor AI referral traffic to understand how many visitors arrive through AI platforms, while zero-click visibility helps you measure how often your brand appears in AI-generated answers or search features without requiring users to click.
Many marketing leaders now compare GEO vs. SEO to understand how content performs in both traditional search engines and AI-powered discovery platforms. Tracking both gives you a more complete picture of your online presence and deserves a place among the marketing metrics every CMO should track.
Benchmarking By Company Stage
-
Startup
Startups should focus on building awareness, validating their product-market fit, and generating qualified leads. At this stage, marketing KPIs usually revolve around website traffic, lead generation, conversion rates, and early customer acquisition. Marketing teams often experiment with different channels and campaigns to identify what resonates most with their target audience before increasing their investment.
-
Scale-Up
As companies enter the scale-up phase, growth becomes the main priority. Marketing leaders need to balance expansion with efficiency by monitoring metrics such as the marketing efficiency ratio, customer acquisition costs, and pipeline contribution. At the same time, developing a consistent brand strategy for growth helps companies strengthen their market position and support future demand generation as competition increases.
-
Mid-Market
Mid-market companies usually have established marketing processes and more predictable revenue goals. Their focus shifts toward improving lead quality, increasing conversion rates, strengthening sales and marketing alignment, and optimizing campaign performance. Comparing results against relevant B2B marketing benchmarks helps identify performance gaps and uncover opportunities to improve efficiency without sacrificing growth.
-
Enterprise
Enterprise organizations evaluate marketing performance across multiple products, business units, and geographic regions. They often prioritize revenue contribution, customer lifetime value, market share, and brand influence over individual campaign metrics. Because enterprise sales cycles are typically longer and involve multiple stakeholders, leaders also monitor pipeline health, forecasting accuracy, and executive reporting to ensure marketing investments support long-term business objectives.
How To Build Your Own Benchmark Dashboard
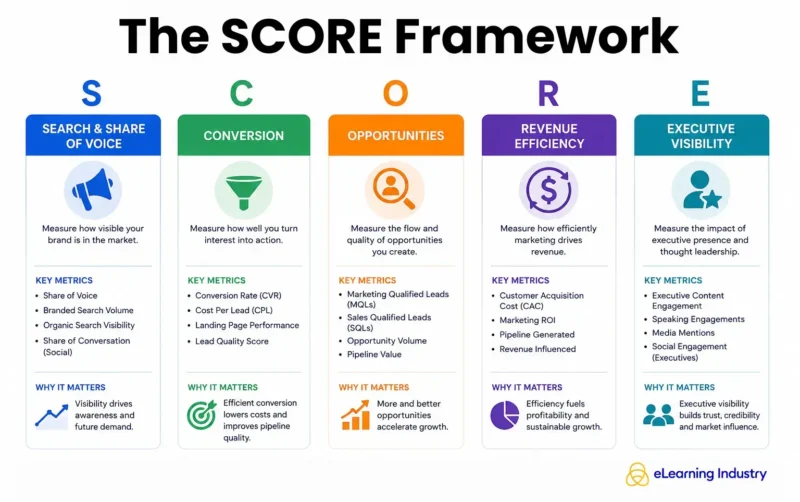
A benchmark dashboard should help you monitor the metrics that have the biggest impact on business growth. Instead of tracking dozens of numbers, organize your dashboard around a simple framework that connects marketing activities with revenue outcomes. The SCORE framework gives executives a practical way to evaluate performance and identify areas that need attention.
S — Search & Share of Voice
Monitor your organic visibility, keyword rankings, Share of Voice, branded search volume, and AI visibility. These metrics show whether your brand reaches potential buyers before they enter the sales process and help you evaluate your position against SaaS marketing benchmarks.
C — Conversion
Track landing page conversions, content downloads, demo requests, webinar registrations, and lead-to-opportunity progression. Reviewing these metrics together helps you identify where prospects drop off and which campaigns produce the strongest results.
O — Opportunities
Measure marketing-generated opportunities, pipeline contribution, and opportunity-to-customer conversion rates. You should also review attribution data to understand which channels and campaigns consistently influence qualified pipeline and revenue.
R — Revenue Efficiency
Focus on customer acquisition cost, cost per lead, customer lifetime value, and ROI. Looking at these metrics together gives you a clearer picture of how efficiently marketing investments support business growth instead of evaluating each metric separately.
E — Executive Visibility
Measure executive engagement on professional platforms, media mentions, speaking opportunities, thought leadership performance, and brand mentions. Combined with the best business lead generation ideas, these indicators help strengthen credibility, increase market visibility, and support long-term demand generation.
Common B2B Marketing Benchmarking Mistakes
-
Comparing Different Industries
One of the biggest benchmarking mistakes is comparing your results with companies that serve different markets or customer segments. B2B marketing benchmarks vary based on industry, product complexity, pricing, and sales cycle length. A benchmark that makes sense for a SaaS company may not apply to a manufacturing business or a professional services firm.
-
Focusing On Averages Instead Of Trends
Industry averages provide useful context, but they should not become your only point of reference. Tracking performance over time helps you understand whether your marketing efforts continue to improve. A steady increase in conversions or pipeline contribution often provides more valuable insight than simply matching an industry average.
-
Ignoring Lead Quality
Generating more leads does not always produce better business results. Marketing teams should evaluate whether campaigns attract targeted leads that fit their ideal customer profile and have a realistic chance of becoming customers. High lead volume means little if sales teams struggle to convert those prospects.
-
Chasing Vanity Metrics
Metrics such as impressions, page views, or social media followers can demonstrate reach, but they rarely show business impact on their own. Instead, combine these numbers with demand generation metrics that reveal how marketing contributes to qualified pipeline, revenue, and long-term growth.
-
Measuring Marketing Without Sales Alignment
Marketing and sales should evaluate performance using shared goals and definitions. Looking only at campaign results without considering sales outcomes can create misleading conclusions. Reviewing conversion rates, revenue contribution, and customer acquisition cost together gives both teams a more accurate view of marketing performance.
The Future Of B2B Marketing Benchmark Measurement
The way companies measure marketing performance continues to change. Traditional reports that focus on clicks and form submissions no longer provide the complete picture. As buying journeys become more complex, B2B marketing benchmarks will increasingly include AI attribution, predictive analytics, first-party data, and intent signals. These metrics help marketing teams understand not only what buyers do but also what they are likely to do next.
Another major shift comes from buying groups. B2B purchasing decisions often involve multiple stakeholders, making it difficult to attribute revenue to a single campaign or interaction. Instead of evaluating one touchpoint, companies need to understand how different marketing activities influence the entire buying process. This approach provides a more accurate view of funnel conversion and highlights which strategies consistently contribute to business growth.
At the same time, AI visibility is becoming an essential metric as buyers use AI assistants and answer engines to research products before visiting company websites. Marketing leaders should also continue monitoring their performance across the top digital marketing channels while adapting to new ways people discover information. Tomorrow's dashboards will measure influence instead of simply counting clicks. Companies that combine traditional performance metrics with AI insights, predictive models, and buyer intent data will make faster decisions and build marketing strategies that support long-term growth.
eLearning Industry Benchmarks
| Sponsored Article Benchmark | eLearning Industry Benchmark |
| Average Page Views per Sponsored Article | 1,500–3,000 |
| Average Engagement Time per Sponsored Article | 2-4 minutes |
| Sponsored Article CTA Click-Through Rate | 3%–5% |
| Cost per Sponsored Article | $800–$2,000 |
| Sponsored Q&A / Expert Interview Benchmark | eLearning Industry Benchmark |
| Average Page Views per Interview | 800–2,000 |
| Average Engagement Time per Sponsored Interview | 3–5 minutes |
| CTA Click-Through Rate | 3%–6% |
| Cost per Sponsored Interview | $1,000–$3,000 |
| Webinar Benchmark | eLearning Industry Benchmark |
| Average Registrations per Webinar | 140-200 |
| Landing Page Conversion Rate | 7%–10% |
| Live Attendance Rate | 40%–60% |
| On-Demand View Rate | 15%–25% |
| Cost per Registration | $60–$80 |
| Estimated Webinar Attendee-to-Vendor-Lead Conversion Rate | 4%–9% |
| Podcast / Video Sponsorship Benchmark | eLearning Industry Benchmark |
| Average Views or Plays per Episode | 500–2,000 |
| Average Episode Completion Rate | 20%–40% |
| CTA Click-Through Rate | 1%–3% |
| Estimated CTA Click-to-Vendor-Lead Conversion Rate | 1%–4% |
| Cost per Sponsored Episode | $3,000–$10,000 |
| eBook Benchmark | eLearning Industry Benchmark |
| Average Downloads per eBook | 160–220 |
| Landing Page Conversion Rate | 12%–15% |
| Cost per Download | $30–$50 |
| Estimated eBook Downloader-to-Vendor-Lead Conversion Rate | 2%–7% |
| Templates & Checklists Benchmark | eLearning Industry Benchmark |
| Average Downloads per Template or Checklist | 120–180 |
| Landing Page Conversion Rate | 8%–12% |
| Cost per Download | $40–$60 |
| Estimated Template/Checklist Downloader-to-Vendor-Lead Conversion Rate | 3%–7% |
| Premium Display Advertising Benchmark | eLearning Industry Benchmark |
| Display Ad Click-Through Rate | 2%–4% |
| Average Cost per Thousand Impressions | $30–$130 |
| Estimated Display Ad Click-to-Vendor-Lead Conversion Rate | 0.5%–1% |
| B2B Email Benchmark | eLearning Industry Benchmark |
| Open Rate | 20%–30% |
| Click-Through Rate | 2%–4% |
| Click-to-Open Rate | 7%–10% |
| Unsubscribe Rate | 0.1%–0.3% |
| Email Click-to-Lead Conversion Rate | 3%–8% |
| Survey Benchmark | eLearning Industry Benchmark |
| Average Completed Survey Responses | 150–300 |
| Survey Completion Rate | 50%–60% |
| Cost per Completed Survey Response | $20–$50 |
| Average Number of Survey Questions | 15–25 questions |
| Average Survey Completion Time | 4–14 minutes |
| Cost per Survey Project | $4,000–$9,000 |
| Co-Branded Research Report | eLearning Industry Benchmark |
| Average Research Report Downloads | 150–250 |
| Research Report Landing Page Conversion Rate | 8%–14% |
| Estimated Report Downloader-to-Vendor-Lead Conversion Rate | 4%–9% |
| Average Report Engagement Time | 5–10 minutes |
| Cost per Co-Branded Research Project | $10,000–$25,000 |
| PPC Directory Benchmark | eLearning Industry Benchmark |
| Average Cost per Vendor Website Click | $10–$30 |
| Vendor Website Click-Through Rate | 8%–16% |
| Estimated Vendor Website Click-to-Lead Conversion Rate | 5%–10% |
| Top List Benchmark | eLearning Industry Benchmark |
| Average Monthly Page Views per Top List | 400–1,000 |
| Average Engagement Time | 4–6 minutes |
| Vendor Profile Click-Through Rate | 5%–9% |
| Estimated Vendor Website Click-to-Lead Conversion Rate | 5%–10% |
Key Takeaway
Measuring marketing success has become far more complex than tracking traffic, leads, or campaign performance alone. As you've seen throughout this guide, B2B marketing benchmarks provide the context you need to evaluate results, identify improvement opportunities, and make smarter business decisions. From conversion rates and B2B CPL benchmarks to CAC benchmarks, pipeline performance, brand visibility, and AI-driven metrics, every benchmark helps you understand whether your marketing investments generate meaningful business outcomes.
At the same time, no benchmark should exist in isolation. You should evaluate acquisition costs alongside customer value, monitor pipeline metrics together with revenue contribution, and measure branded search growth as an indicator of long-term market awareness. This balanced approach gives marketing and sales teams a shared understanding of performance while helping executives allocate budgets with greater confidence. It also creates a stronger foundation for refining your go-to-market strategy as buyer behavior, technology, and competition continue to evolve.
Organizations that combine performance metrics with long-term visibility strategies are better equipped to generate sustainable demand. eLearning Industry helps AI vendors, LMS providers, and HR tech companies improve marketing performance through thought leadership, SEO, GEO, webinars, podcasts, original research, directory visibility, and targeted lead generation campaigns. These initiatives help strengthen both short-term pipeline metrics and long-term brand equity.
FAQB2B marketing benchmarks are industry performance metrics, such as conversion rates, cost per lead, and engagement, that help companies evaluate and improve their marketing effectiveness.
A good B2B conversion rate varies by channel and industry, but landing pages typically convert between 2% and 5%, with high-performing campaigns often exceeding that range.
The average cost per lead depends on the industry and marketing channel, but B2B leads often range from around $50 to several hundred dollars.
CMOs should monitor metrics such as pipeline contribution, customer acquisition cost (CAC), marketing ROI, conversion rates, customer lifetime value (CLV), and branded search growth.
Most organizations review marketing benchmarks monthly or quarterly to identify trends, optimize campaigns, and adjust strategy.
Yes. As AI-powered search grows, tracking AI visibility alongside Share of Voice provides valuable insight into brand presence, competitive positioning, and overall market influence.