


Data As A Language of Impact
Allegedly, like very allegedly, the medieval librarian turned edutainer, Shaq Ira, had a hit song in the taverns of the fictitious Ottland: "Data like hips don't lie." But seriously, data may not lie (intentionally), but what we do with it definitely can. This is why I created a session around practicing the fundamentals of data literacy: reading, writing, interpreting, and arguing with data to make a difference. Thank you to all the brave souls who got hired by TYG (There You Go!) to make data-informed decisions during "ATD's Intensive: Measurement and Analytics in L&D."
Speaking Data, The Language Of Impact
The key takeaway from the session was to think of data differently. Think of data not as a pile of numbers in a spreadsheet or charts in a dashboard, but as a language. A language that can tell a lot about humans: their actions, their decisions, the consequences of their choices, their beliefs, their attitude, etc. A language that we need to practice. Starting with where we should start: asking the right questions instead of jumping into exciting solutioning. In other words:
You need to calm down!
- Dr. Dash Swift from TYG.
Apply critical thinking like Columbo: when smoke comes out of the dog's head instead of the cigar, there might be something wrong with the story presented, even if all the pieces of the story are included in the picture.

AI-generated "Columbo" with smoke coming out of his dog's head
Data Like Hips Don't Lie: What Can Data Tell Us About Learning?
When we design "learning experiences" (or, as in the old days, we called them, courses) without planning to measure their effectiveness after the event, our language of data often focuses on what we have control over: number of completions, time spent in the course, knowledge check scores, and maybe survey data administered right after completion. This is like the Columbo picture above: an illusion. An illusion that we have all the pieces covered. Even if the cigar is not a real one and the placement is fishy.
How To Tell A More Effective Story?
Just like learning a foreign language, speaking data requires practice. Practice is the first to be cut from "long" courses. We may spend a lot of time arguing about that one scenario that ends up pleasing everyone, from content experts to legal and HR. Okay, maybe a couple of scenarios. But, are these the right priorities? Without measuring what matters on the job, it's hard to tell.
TL;DR: what data we focus on tells us what our priorities are.
Learning Is Practice
In my session, I wanted participants to practice. I wanted them to think and reflect, to ask questions, and see how others interpret the same data. The core loop of practice was the following:
- Work in a team
Because that's the only way to see how others interpret the same data. - Read a data statement
These statements refer to a fictitious sales pilot. - Interpret what the sentence means
(Literally and in context) - Discuss the context
And the meaning behind the statement. - Decide if the statement is true, false, or unknown
Based on the data available. - Use the evidence store to buy data evidence items
These items varied from facts, descriptive analyses, interactive data charts, and even results of a linear regression. - Indicate the confidence in your answer (0% - 100%), which affects the total score
In the real world, we often do not have one correct answer. It's not about being correct. It's about how confident we are based on what we know, that we may not be 100% correct. - Finally, provide a brief explanation of your choice in an open-text field
Optionally, you could also attach a piece of evidence purchased to support the decision.
Once the decision is submitted, the team can move on to the following statement. Each of these elements above generated data: individual, team, and cross-team data to tell the story.
Generating and collecting data like hips don't lie is the first step. Next, I wanted to share the high-level design of how I used the data to help me make more informed decisions. Each of these examples serves a purpose and tells a specific story so that the facilitator can provide feedback on the fly. I built the application using AI tools such as ChatGPT for creating the original PRD document, Windsurf with Claude Sonnet to execute the project (including Model Context Protocol servers like Sequential Thinking), GitHub to store the code, Vercel to deploy, and Supabase to store data.
Team Progress Summary
- Purpose
A glance at the teams' progress in submitting decisions
Decisions to support, questions to answer:
- Which team has selected a member to be the program manager (PM)?
- Is any team running behind with the selection?
- In what order should I visit the teams?
- How's progress across teams for each statement (0% - 100%)?
- For the debrief, how do I remind teams of the statement? (S1 - S18 are statement codes but not the actual verbiage.)
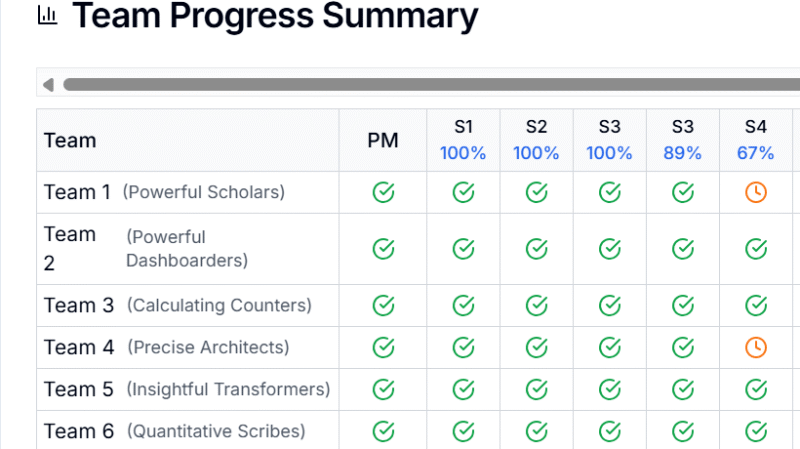
The team progress summary provides a quick glance at progress across teams
This view had to be concise and simple. I used it to keep an eye on the progress across multiple teams. The column headers tell me the exact percentage of teams done in that round, and hovering over the labels reminds me of the actual statement. I used this view to decide in which order to visit the breakout rooms to see if any help was needed.
What story is this data view not telling? About the actual decisions. I can see the teams made a decision, but I don't know what decision they made.
Statement Details View
- Purpose
Show aggregated data about each statement with details.
Decisions to support, questions to answer:
- How many teams have responded to the statement?
- What is the average confidence level across teams?
- What is the agreement level across teams? Did they select the same answer?
Then, once I opened one of these "cards," I wanted to see details about what caused the mix-up or disagreement.
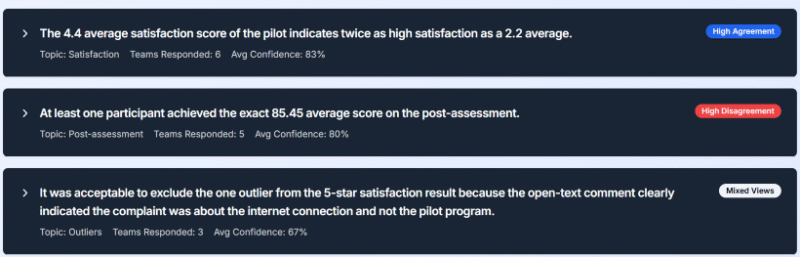
The card headings give me a heads up on the confidence the teams had and whether they all agreed on the same choice, or there were mixed opinions. These insights help to move quickly when there is a high agreement and spend more time on those statements where participants did not agree.
- The Nuances
As I said earlier, we often think of data-informed decisions as number-driven choices. However, relying solely on numbers can completely hide the nuances and depth that can facilitate the conversation and provide actionable feedback. That is why I added the required open-text justification for the teams.
The challenge with the qualitative data, especially open-text input, is that it requires time and effort to read and analyze. This is where AI can help. Using the ChatGPT API, all comments were analyzed and summarized to help me understand common themes and arguments. While I didn't invest more time in the solution I built, there's still a backlog item to include the open-text reasoning in the scoring itself.
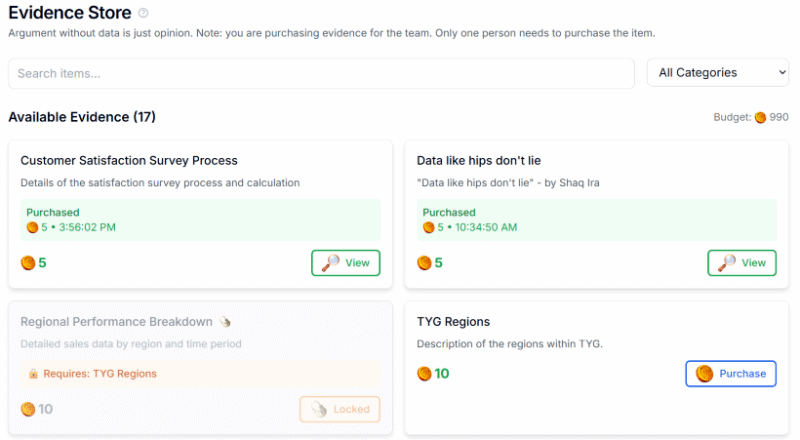
Data Like Hips Don't Lie: The Evidence Store
- Purpose
The evidence store lists various items from statements through charts that can help the team make a data-informed decision.
Each item has a price, and each team has a limit of coins to spend. This is to ensure not all items can be purchased. Just like in real life, you need to prioritize your limited resources and often make trade-offs. You cannot wait until you have all the data to be 100% confident in your answers. And sometimes, you need to make decisions without even having "enough" data.
The evidence store includes interactive data charts for purchase
As an example, the interactive data chart below helps teams understand the concept of change in a statistical sense. This interactive chart lets users select different types of datasets to demonstrate pre- and post-score size effects. Users can view what a no effect, a small effect, a large effect, or a random chance looks like.
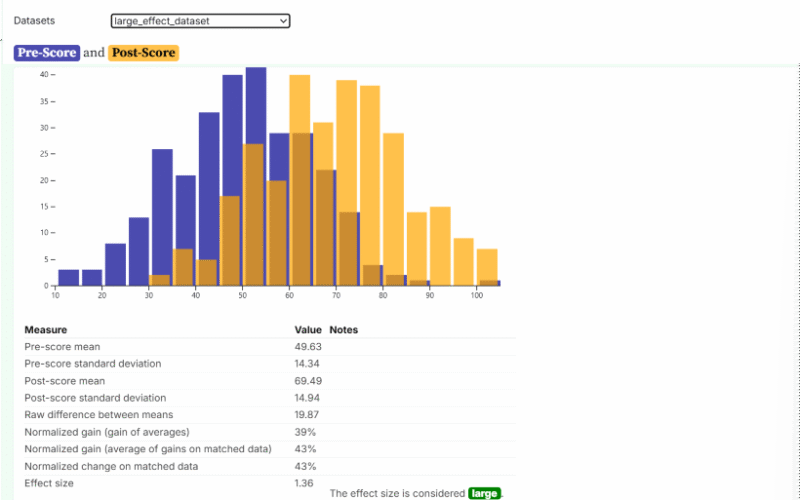
Interactive chart demonstrating different sizes of change
The calculations show that changes in the raw average score may not indicate the same magnitude of change as normalized learning change or effect size.
I also built an Evidence View to see which pieces of evidence have been purchased by the teams how many times. Where would I start with data? Again, at the end. I would buy the process used for the pilot, along with the project's success criteria. Understanding what matters may change where you spend more effort and time to make data decisions.
Conclusion
Data is not just numbers in a spreadsheet or charts in a dashboard. Data like hips don't lie is the footprint of human activity, actions, decisions, feelings, attitudes, culture, and all. Think of data as the fundamental building blocks of a language that you can use to tell meaningful stories that change lives. Or, if you would rather be more practical, start with the decisions to make or questions to answer and work backwards towards the insights and information that make data actionable.
P.S. I know there are three distinct schools of thought about data. One that believes it is singular, one that considers data plural, and the rest of us going like: "Is this really your biggest problem right now?"
Image Credits:
- All images within the body of the article were created/supplied by the author. The AI-generated image of "Columbo" with smoke coming out of his dog's head was generated by Zsolt Olah via Midjourney (2024).