

Data Alone Aren't Enough. You Need To Translate Them Into Decisions.
Companies make important decisions every day. Which markets should you enter? What price should you charge? Why are customers leaving? Which marketing channels generate the best opportunities? And how do you know which product features deserve investment? Without reliable evidence, these decisions can depend heavily on assumptions, intuition, or incomplete information. This is where quantitative business research examples become particularly useful.
According to Model N's State of Revenue Report, 85% of companies use data to support many or all of their business decisions, yet only 44% of executives consider their organizations very data-driven. This gap highlights the need to turn available information into meaningful insights that support better decisions.
Through business quantitative research, organizations can investigate customer behavior, evaluate market opportunities, measure performance, and identify areas for improvement. From pricing research and customer segmentation to predictive analytics and campaign experiments, these methods support data-driven growth.
Let's explore 12 examples of quantitative business research and show you how companies like yours can apply each one to a specific business challenge.
Key Takeaways
- Quantitative business research uses numerical data and statistical methods to investigate business questions.
- Common methods include structured surveys, experiments, statistical analysis, and quantitative market research.
- Companies use quantitative research to understand customers, evaluate products, optimize marketing, assess pricing, and improve operations.
- The most useful research begins with a specific business decision rather than collecting data without a purpose.
- Quantitative findings can identify patterns and relationships, but they don't automatically explain why those patterns exist.
- Combining quantitative and qualitative research often produces a more complete understanding of business challenges.
- Research quality depends on reliable data, appropriate sampling, sound methodology, and careful interpretation.
In This Guide, You Will Find...
- What Is Quantitative Business Research?
- 12 Quantitative Business Research Examples
- Quantitative Business Research Methods: Which Should You Use?
- Quantitative vs. Qualitative Business Research: What's The Difference?
- How To Turn Quantitative Research Into Better Business Decisions
- Common Mistakes In Quantitative Business Research
What Is Quantitative Business Research?
Quantitative business research is the systematic collection and analysis of numerical data to measure business conditions, identify patterns, test hypotheses, and support decisions about customers, products, markets, marketing, operations, and organizational performance.
In simple terms, it helps you answer measurable business questions. How many customers are likely to renew their subscriptions? How much are buyers willing to pay? What percentage of employees feel engaged? How often do prospects convert into customers? Is there a measurable difference between two marketing campaigns? And is there a relationship between customer satisfaction and retention?
Companies use several quantitative business research methods to investigate these questions, including structured surveys, controlled experiments, statistical analysis, quantitative observational studies, and analysis of existing business datasets.
However, there's an important distinction between research and routine reporting. A dashboard displaying conversion rates or B2B lead generation benchmarks provides useful performance information, but it doesn't automatically qualify as research. You need a defined question, an appropriate methodology, and systematic analysis to understand what the numbers reveal.
When applied correctly, quantitative research in business strategy helps decision-makers move beyond surface-level metrics. It also complements business intelligence by providing structured evidence to explain patterns, test assumptions, and evaluate potential business opportunities.
12 Quantitative Business Research Examples
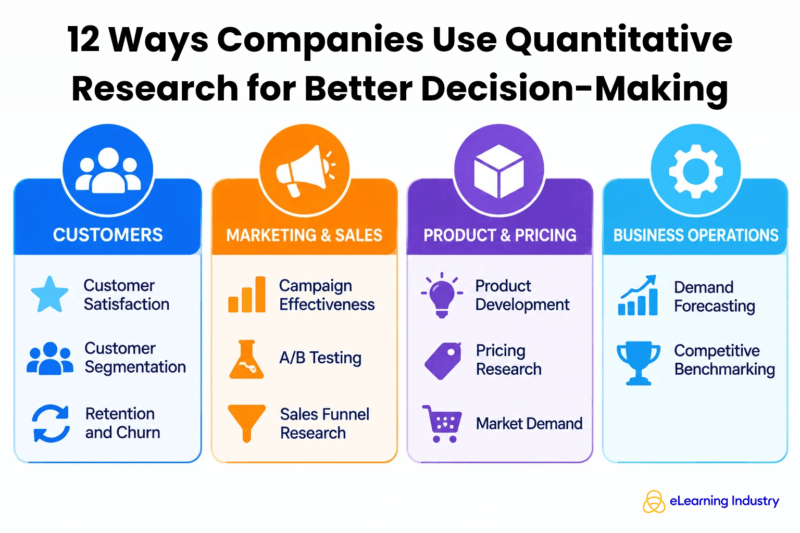
Companies make decisions about pricing, product development, marketing, customer retention, and growth every day. However, how can you know whether those decisions will produce the desired results? Quantitative research examples show how companies use these methods for more accurate business decision-making.
1. Customer Satisfaction Research
Business question: How satisfied are your customers, and which aspects of their experience need improvement?
Customer satisfaction research helps companies understand how buyers evaluate their products, services, and interactions with their teams.
Research method: Structured customer satisfaction surveys using rating scales and standardized questions.
Data collected:
- Overall customer satisfaction scores.
- Ratings for specific service attributes.
- Response distributions across customer groups.
- Satisfaction differences based on customer tenure or subscription type.
Example finding: Imagine a SaaS company surveying 500 customers. Hypothetical results show that 85% rate its software positively, but only 58% are satisfied with technical support. Enterprise customers also report longer resolution times than SMB customers.
Business decision: The company investigates support response times, reviews its ticket-handling process, and allocates additional resources to enterprise accounts.
Key takeaway: Quantitative research in customer satisfaction helps companies identify measurable experience gaps and prioritize improvements that strengthen customer relationships.
2. Market Demand Research
Business question: Is there sufficient demand for a new product or service?
Before investing in a new offering, companies need to understand whether potential customers have a genuine need for it. Quantitative research methods in business estimate interest, identify segments, and evaluate purchase intentions.
Research method: Quantitative market surveys combined with relevant market data.
Data collected:
- Purchase interest.
- Available budgets.
- Adoption of existing solutions.
- Intended purchasing timelines.
- Industry and company characteristics.
Example finding: An LMS vendor evaluates demand for AI-powered learning analytics among mid-market companies. A hypothetical survey of 300 HR and L&D decision-makers reveals that 65% express interest, while 40% have allocated a budget for analytics improvements within 12 months.
Business decision: The vendor estimates the addressable opportunity and conducts further product validation before committing significant development resources.
Key takeaway: Market demand research helps companies evaluate new opportunities before investing. However, stated purchase intent doesn't necessarily translate into actual purchasing behavior, so companies should validate demand generation best practices against real buying patterns.
3. Pricing Research
Business question: What pricing structure will customers accept?
Pricing decisions influence revenue, profitability, and market positioning. Charge too much, and you may discourage potential buyers. Charge too little, and you could limit revenue potential.
Research method: Structured pricing surveys, choice-based experiments, and controlled pricing tests.
Data collected:
- Price preferences.
- Willingness-to-pay estimates.
- Subscription package preferences.
- Purchase probabilities at different price points.
- Actual revenue and conversion outcomes, where available.
Example finding: A Learning Tech vendor evaluates subscription pricing among SMB and enterprise customers. Hypothetical findings show that smaller companies prefer predictable monthly subscriptions, while enterprise buyers value annual contracts with advanced reporting and dedicated support.
Business decision: The company develops differentiated subscription packages and tests their pricing with relevant customer groups.
Key takeaway: Pricing research helps businesses refine packaging, understand willingness to pay, and evaluate how different pricing structures may influence conversion and revenue.
4. Marketing Campaign Effectiveness Research
Business question: Which campaigns generate meaningful business outcomes?
Among the most practical quantitative business research examples are studies that help companies evaluate marketing performance. High impressions and click-through rates don't necessarily mean a campaign attracts qualified prospects or generates revenue. Marketing teams need to evaluate the commercial impact of their activities.
Research method: Controlled experiments and quantitative campaign performance analysis.
Data collected:
- Conversion rates.
- Cost per lead and customer acquisition cost.
- Marketing-qualified and sales-qualified leads.
- Opportunities generated.
- Associated revenue.
Example finding: A B2B software company compares two campaigns targeting similar buyer segments. Hypothetical results show that Campaign A generates more leads, but Campaign B produces 30% more qualified opportunities.
Business decision: The marketing team investigates audience quality and reallocates resources toward the campaign generating stronger commercial outcomes.
Key takeaway: Campaign research helps marketers evaluate performance beyond engagement metrics. Understanding marketing intelligence vs. marketing research also helps distinguish routine performance monitoring from systematic investigations into why results differ.
5. Customer Segmentation Research
Business question: Which customer groups have different needs, behaviors, and commercial potential?
Not every customer buys for the same reasons or expects the same product experience. Identifying these differences helps companies develop more relevant positioning, pricing, and go-to-market strategy.
Research method: Structured surveys combined with statistical segmentation analysis.
Data collected:
- Company size and industry.
- Purchasing behavior.
- Product usage patterns.
- Available budgets.
- Customer needs and preferences.
Example finding: An HR Tech company analyzes data from 600 customers. Hypothetical findings identify two distinct groups: SMB buyers who prioritize affordability and ease of implementation, and enterprise buyers who value integrations, security, and customization.
Business decision: The company adjusts its messaging, product packages, and sales approaches to address each group's priorities.
Key takeaway: Statistical analysis helps businesses identify commercially meaningful customer groups using measurable characteristics rather than relying exclusively on assumptions.
6. Product Development Research
Business question: Which product improvements should receive priority?
Product teams regularly face difficult investment decisions. Customers may request dozens of features, but development resources are limited. Quantitative research helps teams identify which improvements address the most significant needs.
Research method: Feature-preference surveys, controlled experiments, and quantitative usage analysis.
Data collected:
- Feature adoption rates.
- Usage frequency.
- Task completion rates.
- Customer preference scores.
- Feature importance ratings.
Example finding: An LMS vendor examines how administrators use its reporting tools. Hypothetical findings show that 70% regularly export learning reports, but only 35% use advanced filtering because they find the process difficult.
Business decision: The product team prioritizes reporting improvements and simplifies the filtering functionality.
Key takeaway: Product research helps organizations allocate development resources according to measurable customer needs rather than relying exclusively on internal assumptions or feature requests.
7. Employee Engagement Research
Business question: What factors are associated with employee engagement?
Employee engagement influences workplace experience, productivity, and retention. However, managers need to understand how employees perceive their working environment before introducing improvements.
Research method: Structured employee surveys and statistical analysis.
Data collected:
- Engagement scores.
- Manager effectiveness ratings.
- Recognition and career development perceptions.
- Workload ratings.
- Intent to stay.
Example finding: A growing SaaS company surveys employees across four departments. Hypothetical results reveal that the product team reports lower engagement, particularly regarding workload distribution and career development opportunities.
Business decision: Management investigates these issues, reviews team responsibilities, and introduces targeted development initiatives.
Key takeaway: Employee surveys help organizations identify workplace problems and evaluate whether targeted improvements are associated with better engagement. However, correlation between workplace factors and engagement doesn't automatically establish causation.
8. Customer Retention And Churn Research
Business question: Which measurable factors are associated with customer churn?
For subscription-based companies, retaining existing customers is essential for sustainable revenue. Understanding which behaviors are associated with cancellations can help customer success teams identify potential risks.
Research method: Cohort analysis, statistical modeling, and quantitative customer surveys.
Data collected:
- Renewal and cancellation rates.
- Product adoption.
- Usage frequency.
- Customer support activity.
- Subscription duration.
- Satisfaction scores.
Example finding: A software provider examines customer cohorts over 12 months. Hypothetical results reveal that customers using fewer than three core features during their first 60 days have higher subsequent churn rates.
Business decision: The company introduces improved onboarding, product tutorials, and proactive customer support. It then compares retention outcomes between customers receiving the new experience and an appropriate comparison group.
Key takeaway: Retention research identifies potential churn indicators and helps companies test improvements to customer success processes, including how they use the top lead generation tools to attract better-fit customers.
9. A/B Testing And Conversion Optimization
Business question: Which website or product experience produces better outcomes?
Changes to landing pages, registration forms, and product interfaces can influence how people interact with your business. Instead of relying on opinions, companies can compare alternatives through controlled experiments.
Research method: Randomized A/B testing.
Data collected:
- Website conversion rates.
- Click-through rates.
- Form submissions.
- Trial registrations.
- Demo requests.
Example finding: A B2B SaaS company tests two landing-page headlines. Version A emphasizes product features, while Version B focuses on business outcomes. In a hypothetical experiment, Version B achieves a 12% higher demo-request conversion rate.
Business decision: The marketing team considers adopting Version B after confirming sufficient sample size, appropriate randomization, and statistically reliable results.
Key takeaway: Experiments help businesses evaluate changes using measurable evidence. Sample size and statistical uncertainty matter because an apparent improvement may simply reflect random variation.
10. Competitive Benchmarking Research
Business question: How does your company's performance compare with competitors and relevant market standards?
Quantitative business research examples also show how companies can assess their competitive position. Understanding competitor positioning and performance can reveal opportunities to improve your commercial strategy. However, comparisons are only useful when the underlying data is relevant and measured consistently.
Research method: Structured comparative analysis using quantitative datasets.
Data collected:
- Market share estimates.
- Competitor pricing.
- Product adoption indicators.
- Brand sentiment.
- Growth rates.
- Search visibility.
Example finding: An LMS company evaluates its visibility across industry publications and organic search results. Hypothetical findings show that competitors receive more relevant industry mentions, while the company performs better in specialized learning technology topics.
Business decision: The marketing team identifies content opportunities and reviews its positioning to improve visibility in strategically important areas.
Key takeaway: Competitive benchmarking helps companies identify performance gaps and evaluate their market position. For example, share of voice SEO can reveal how visible your brand is compared with competing companies in organic search.
11. Demand Forecasting Research
Business question: What level of future demand should your company prepare for?
Companies need reliable demand estimates to plan staffing, budgets, inventory, and service capacity. Historical performance provides a useful starting point, but organizations should also consider seasonality and changing market conditions.
Research method: Time-series analysis and quantitative forecasting models.
Data collected:
- Historical sales and demand.
- Seasonal patterns.
- Sales pipeline data.
- Market trends.
- Economic indicators.
- Product adoption rates.
Example finding: A corporate training provider analyzes three years of enrollment data. Hypothetical forecasting results identify recurring increases in leadership development demand during the first quarter.
Business decision: The company adjusts instructor availability, delivery capacity, and resource allocation to prepare for expected demand.
Key takeaway: Forecasting supports operational planning and investment decisions. However, forecasts are estimates, not guarantees. Companies should review accuracy and update assumptions as market conditions change.
12. Customer Acquisition And Sales Funnel Research
Business question: Where are potential customers dropping out of the buying process?
Generating leads is only one part of customer acquisition. Companies also need to understand how prospects move through the sales funnel and where conversion problems occur.
Research method: Funnel analysis, cohort analysis, and statistical testing.
Data collected:
- Website visitors and conversion rates.
- Marketing-qualified to sales-qualified lead conversion.
- Opportunity creation rates.
- Sales-cycle duration.
- Win rates.
- Customer acquisition costs.
Example finding: A B2B Learning Tech vendor analyzes its sales funnel over six months. Hypothetical findings show that demo requests are increasing, but only 25% become qualified opportunities. Further analysis reveals that many prospects come from companies outside its target market.
Business decision: Marketing and sales teams review targeting criteria, improve lead qualification, and adjust their lead nurturing strategies. They also introduce clearer qualification requirements to improve the handoff between departments.
Key takeaway: Funnel research helps companies identify barriers to revenue growth and determine where acquisition processes need improvement. Teams can compare their results with relevant lead generation benchmarks and try to adjust to attract more qualified prospects.
Quantitative Business Research Methods: Which Should You Use?
| Research Method | Best Used For | Example |
| Structured surveys | Measuring opinions, preferences, and experiences | Customer satisfaction |
| Experiments / A/B tests | Testing causal effects under controlled conditions | Landing-page optimization |
| Statistical analysis | Identifying patterns and relationships | Churn analysis |
| Quantitative observational studies | Studying measurable behavior without intervention | Product usage |
| Secondary data analysis | Investigating existing datasets | Market sizing |
| Forecasting models | Estimating future outcomes | Demand forecasting |
Quantitative business research methods aren't mutually exclusive. A company might use survey findings to identify a potential problem, analyze behavioral data to understand its scope, and then run an experiment to evaluate a proposed solution. Combining approaches helps teams make informed decisions and connect customer insights with a full-funnel marketing strategy.
Quantitative vs. Qualitative Business Research: What's The Difference?
| Quantitative Research | Qualitative Research |
| Focuses on numerical evidence | Focuses on experiences, meaning, and context |
| Measures patterns and differences | Explores motivations and explanations |
| Often uses structured surveys and experiments | Often uses interviews and open-ended research |
| Supports statistical analysis | Supports thematic interpretation |
| Example: 38% of surveyed customers report a problem | Example: Interviews explore why customers experience that problem |
Quantitative and qualitative research offer complementary ways to understand business challenges. Some quantitative business research examples measure how many customers experience a problem, how frequently it occurs, or which segments are most affected. Qualitative research explores people's experiences, motivations, and perceptions to help explain those findings. Neither approach is inherently more rigorous or reliable, as the quality of each depends on the research question, methodology, and analysis. Combining both can give your team a fuller understanding of customers and support better decisions for driving growth.
How To Turn Quantitative Research Into Better Business Decisions
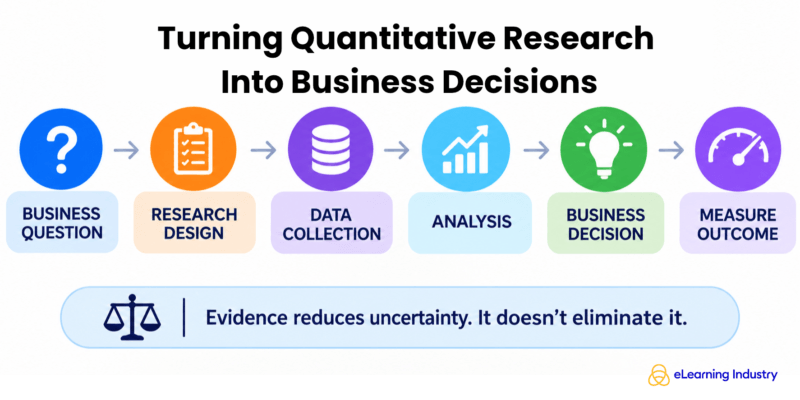
Step 1: Define The Business Decision
Start with the decision you need to make, not the data you already have. For example, should your company invest in developing an AI-powered LMS feature? A clear decision gives your research a practical purpose.
Step 2: Formulate A Measurable Research Question
Turn the decision into a question you can answer with numerical evidence. For example: What proportion of our target customers would find the feature valuable? Define what you want to measure and which customer groups matter.
Step 3: Choose The Appropriate Research Method
Select a method that fits your question. You might use a structured customer survey to measure interest, product usage analysis to understand existing behavior, or a controlled experiment to compare different solutions. The right research methodology depends on the evidence you need.
Step 4: Collect And Validate The Data
Before analyzing results, check that your data supports meaningful conclusions. Consider sample representativeness, data quality, measurement validity, potential bias, and statistical uncertainty. Even useful quantitative business research examples can lead to misleading decisions when the underlying data is weak.
Step 5: Analyze The Findings
Look for patterns, differences between customer groups, and relationships between variables. For instance, combine survey results with marketing analytics to understand whether interest in the feature differs by company size. Other questions, such as what is share of voice, may require different data sources, including social listening for B2B marketers.
Step 6: Make A Decision And Measure The Outcome
Use your findings to inform the investment decision, then track what happens after implementation. Measure adoption, customer satisfaction, and commercial outcomes to determine whether the decision delivered the expected value. Use those results to guide your next decision.
Common Mistakes In Quantitative Business Research
- Collecting data without a clear question: Define the business decision before starting market research.
- Using unrepresentative samples: Ensure participants reflect your target population, not just those easiest to reach.
- Confusing correlation with causation: A relationship between two variables doesn't prove one causes the other.
- Ignoring uncertainty: Consider sample size, confidence intervals, and statistical significance where relevant.
- Assuming purchase intent guarantees sales: Survey responses don't always predict actual buying behavior.
- Cherry-picking metrics: Don't select only results that support your preferred conclusion.
- Overlooking customer differences: Analyze relevant segments instead of relying solely on averages or broad B2B marketing benchmarks.
- Ignoring qualitative context: Combine quantitative data analysis in business with customer feedback to understand the findings. A/B testing can help evaluate proposed changes.
- Failing to measure outcomes: Track business performance after implementation to determine whether your decision delivered the expected results.
Conclusion
Quantitative business research isn't reserved for large enterprises or specialist research departments. Companies of all sizes can use measurable evidence to understand customer needs, evaluate market opportunities, refine pricing, prioritize product development, assess marketing performance, improve employee engagement, and strengthen retention. These quantitative business research examples show that even focused investigations can help organizations identify problems, test assumptions, and uncover opportunities for growth.
Whether you're conducting pricing research, measuring customer satisfaction, or using media monitoring to understand brand visibility, the important thing is to connect your findings to a specific business decision. You don't need an extensive research department or complicated systems to get started. You need a clear question, relevant data, and an appropriate method for analyzing the results.
Ultimately, quantitative research for business decisions is about turning evidence into action. The goal is to ask better questions, interpret evidence carefully, and make decisions you can evaluate and improve over time.
FAQs-
Customer satisfaction surveys: Measuring satisfaction scores and customer loyalty.
-
Market research: Estimating market size, demand, and purchasing preferences.
-
Sales analysis: Tracking revenue, conversion rates, and sales performance.
-
Employee surveys: Measuring engagement, retention, and workplace satisfaction.
-
Pricing research: Comparing customer responses to different price points.
-
Product testing: Measuring adoption, usage, and feature preferences.
-
Advertising analysis: Evaluating click-through rates, conversions, and campaign ROI.
Quantitative business research helps organizations measure conditions, identify patterns, test hypotheses, and make evidence-based decisions. Businesses can use numerical data to assess customer behavior, evaluate employee performance, compare marketing campaigns, and forecast demand. It also helps determine whether a strategy or intervention produces measurable results.
-
Structured surveys: Collecting standardized responses from customers or employees.
-
Experiments: Testing variables, such as different prices or marketing messages, to measure their effects.
-
Statistical analysis: Using numerical techniques to identify trends, relationships, and patterns.
-
Observational research: Analyzing measurable behaviors, transactions, or activities without directly influencing them.
Quantitative research focuses on numerical data to measure trends and test hypotheses, while qualitative research explores experiences, opinions, and motivations.
For example, a company might use a survey to measure customer satisfaction scores (quantitative research) and conduct interviews to understand why customers are dissatisfied (qualitative research).
-
Survey customers using affordable online tools.
-
Test different prices, offers, or website layouts.
-
Analyze existing sales, website, and customer data.
-
Track repeat purchases, conversion rates, and customer retention.
-
Use publicly available industry reports and government datasets.
