Proving Training Value With Analytics And Dashboards
In today's dynamic learning environment, organizations are realizing that training isn't just an expense; it's an investment that drives performance, engagement, and business growth. Yet, proving this value has always been a challenge. That's where analytics and dashboards in Learning Management Systems (LMSs) are transforming the way companies measure learning impact. Modern eLearning, powered by integrated data insights, is turning training programs from perceived cost centers into measurable growth assets.
Whether you're running corporate training, educational programs, or partner enablement, data-driven learning through an LMS, Training Management System (TMS), or Learning Experience Platform (LXP) is no longer optional; it's essential.
From Guesswork To Insight: The Power Of Learning Analytics
Traditional training approaches like classroom-based Instructor-Led Training (ILT) or even early eLearning systems often lacked visibility. Trainers could see attendance numbers but not whether learners were truly engaging, understanding, or applying new skills. Now, with modern LMS platforms, every learner action generates data: course completions, time spent on modules, quiz performance, engagement with videos, discussion activity, and even post-training application. This data flows into real-time analytics dashboards, offering a complete view of the learning journey.
Analytics help organizations move away from guesswork. Instead of assuming a course works, they can answer specific questions:
- Which courses have the highest completion rates?
- What content formats engage learners the most: videos, quizzes, or live sessions?
- Which employees or departments show performance improvements after training?
- Where are learners dropping off, and why?
These insights allow L&D teams to continuously improve learning programs and ensure resources are invested where they make the greatest impact.
Transforming The LMS Into A Strategic Tool
An LMS equipped with powerful analytics does more than deliver training; it drives strategic decisions. Organizations can link training outcomes with business KPIs like sales growth, productivity, compliance, or employee retention.
For instance, a company implementing a blended learning approach combining online eLearning modules with live Virtual Instructor-Led Training (VILT) sessions can use analytics to see how digital learning complements classroom interaction. Dashboards can reveal that learners who complete both online modules and live sessions perform 30% better in real-world tasks compared to those who only attend ILT sessions.
This data-driven approach helps decision-makers justify training budgets with hard numbers. It turns conversations from "training is expensive" to "training increases efficiency, revenue, and employee satisfaction."
The Role Of Dashboards In The Modern Learning Ecosystem
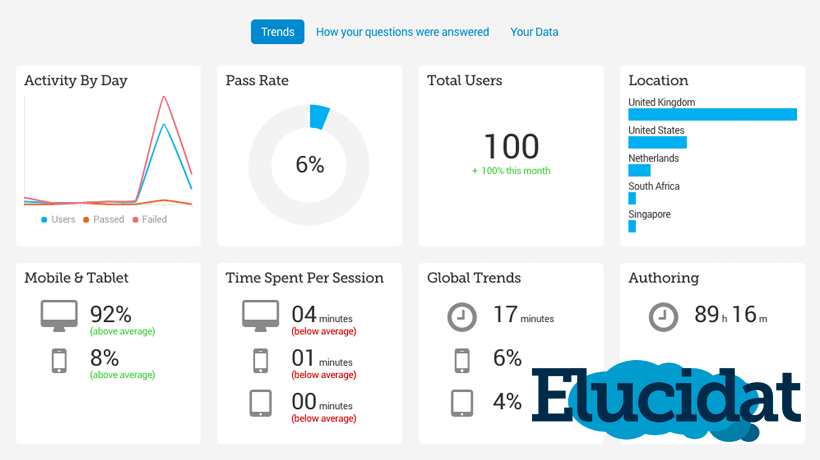
Dashboards are the visual heartbeat of an LMS, TMS, or LXP. They transform raw data into clear, actionable insights. Modern dashboards are not just static reports; they're interactive, customizable, and role-based. For example:
- Learners can view progress reports, course completion badges, and personal skill metrics, fuelling motivation.
- Instructors can track class attendance, engagement levels, and assessment outcomes to adjust their teaching methods.
- Managers can evaluate team learning progress, compare department-wise performance, and identify training gaps.
- Executives can correlate learning metrics with organizational goals, such as faster onboarding or improved compliance rates.
By centralizing data in one visual platform, dashboards make learning transparent and goal-oriented.
Beyond LMSs: How TMSs And LXPs Enhance Data-Driven Learning
While an LMS focuses primarily on managing and delivering courses, a TMS streamlines logistics, scheduling sessions, managing instructors, allocating resources, and tracking budgets. When integrated, LMS and TMS analytics give a full 360° view: not just how learning performs, but how efficiently it operates.
Similarly, LXP analytics go a step further by analyzing learner preferences, content consumption patterns, and social learning behaviors. LXPs personalize recommendations similar to how Netflix suggests content based on user interests and career goals. When an LMS and an LXP work together, organizations can measure both learning outcomes and learner experience, ensuring the content truly resonates.
Connecting Learning Data To Business Value
The goal of LMS analytics isn't just reporting; it's linking training to business outcomes. For instance:
- Sales enablement
Analytics show that employees who completed product training modules via eLearning sold 20% more in the following quarter. - Compliance training
Dashboards confirm that 98% of employees completed mandatory training on time, reducing legal risk. - Customer training
Companies using an LMS for client education can track customer engagement, leading to higher satisfaction and retention. - Employee retention
Learning analytics may reveal that teams with consistent training opportunities have lower turnover rates.
By quantifying such results, training moves from being a "soft skill investment" to a measurable driver of performance and profit.
Predictive Analytics: Shaping The Future Of Learning
Next-generation LMS platforms are now embedding predictive analytics using AI and Machine Learning to forecast future outcomes. Instead of simply reporting past behavior, the system predicts who might drop out of a course, which content will engage certain roles, or what skills will be in demand next quarter.
For example, a VILT session's attendance pattern can predict which learners are likely to disengage. Automated alerts can then prompt instructors to intervene early. Predictive analytics transforms learning from reactive to proactive, ensuring continuous improvement and personalized learning journeys.
Making Learning Measurable In A Blended World
Today's learning landscape blends multiple modalities: eLearning, ILT, VILT, and self-paced microlearning. In this complex environment, analytics dashboards unify everything under one lens. Organizations can now see:
- How online and offline learning reinforce each other.
- Which channels deliver the highest ROI.
- How learner performance improves over time across modalities.
A blended learning strategy supported by analytics ensures that training is not fragmented but interconnected, creating a seamless experience where every learning moment adds measurable value.
Conclusion: Turning Training Into A Growth Engine
The days of viewing training as a cost are over. With advanced analytics and dashboards in LMS, TMS, and LXP platforms, organizations can now clearly demonstrate the ROI of their learning programs. By measuring engagement, performance, and business outcomes, they're not just tracking learning; they're shaping it strategically.
As AI, automation, and data visualization continue to evolve, analytics will further redefine how learning drives growth. Whether it's corporate onboarding, customer education, or skill development, data is the bridge between effort and impact. In the end, analytics make learning measurable, meaningful, and profitable, transforming every training initiative from a cost to a true organizational asset.


