

Identify Your Key Metrics To Maximize L&D Impact
If the analytics in your LMS overwhelm you, you're not alone. Getting a clear picture of the success of Learning and Development programs can be a tricky business.
It's not as simple as just collecting a handful of numbers and calling it a day. To figure out how your learning programs are really doing, you need to track and pull the correct data and know how to make sense of it all. You'll also need to understand how to translate that data into reports to show clear results—especially since you'll almost certainly be asked to prove ROI on your programs this year.
But you don't have to be a data analyst to get insights into the ROI of your L&D programs. You can start by pulling a handful of critical data points from your LMS to get a better picture of the impact of your programs. The key is to be intentional about which metrics to keep an eye on.
With so many metrics to track and analyze, which ones do you choose, and how do you measure and report them? To drive better results for your L&D teams and learners, go beyond reviewing test scores and analyze these key metrics that track learner progress, engagement, and feedback.
Learner Progress Metrics Help You Improve Completion Rates
Learner progress can tell us a lot about the quality and effectiveness of our courses. For example, Massive Open Online Courses (MOOCs) had less than 10% completion rates in 2022.
That metric alone only gives us one piece of the puzzle—90% of courses weren't completed—but by tracking a few learner progress metrics, you'll get a clearer picture of how well your employees are retaining information and what kind of progress they're making toward their learning goals.
These learner progress indicators can give you essential insights to make better decisions, drive better results, and maximize your ROI.
Course Signups And Dropout Rates Reveal Popular And Underperforming Courses
Dropout and enrollment rates reflect how well your courses and topics resonate with your learners.
If a course has a lot of signups and a high dropout rate, it could mean the subject is attracting interest, but the material isn't delivering on its promise. On the other hand, if you see a high number of signups and the dropout rate is low, you'll know that course is hitting the sweet spot of interest and engagement.
Adjustments based on these metrics can keep your learners enrolled and increase completion rates. For example, if a course isn't performing up to expectations, you can update the content by making it more interactive using quizzes or sprinkling in some gamification. If a class is outperforming, it could present an opportunity to create in-depth series on that topic.
Course Completions Reveal The Quality And Effectiveness Of Your Content Delivery
Course completion rates are simple—they tell you how many of your learners actually finish the courses they start. It's a great indicator of the quality and effectiveness of your content delivery and lets you know if learners connect with the content.
For non-mandatory courses, a high course completion rate is a clear sign that your learners find value in your courses and that your content delivery is on target. A low course completion rate could mean that your learners are overwhelmed by or losing interest in the material.
By analyzing your course completion data, you can find areas for improvement and implement changes to encourage more students to finish their courses. For example, if a course has a low completion rate, you can employ microlearning to break down the lessons into smaller, more manageable chunks. Shortening your training sessions can significantly improve learner participation. In one study, 58% of respondents said they would be more likely to use their company's LMS if it included shorter lessons.
Engagement Metrics Provide Insights For Improving Retention
If you want to keep your learners hooked, you've got to keep them engaged. Making tweaks and improvements based on feedback from a few key engagement metrics can help you better cater to your learners, resulting in a more enjoyable and impactful learning experience for them.
The following metrics can help you gain insight into what's resonating with your learners and highlight where you might need to make improvements.
Course Dropoff Rates Pinpoint Weak Areas In Your Course Content
While dropout rates display where learners left a course, dropoff rates highlight precisely where they're giving up. This information is crucial to identify weak points in your training, as it reveals the exact areas where modifications will have a more considerable impact.
Once you pinpoint the places where high numbers of learners drop off, you'll need to do some investigative work to find out why. This part of the course might be too challenging, tedious, or irrelevant to employee needs.
Rather than guessing or acting off a hunch, ask enrolled learners to complete a course evaluation. Ask if the course met their needs and expectations, and whether the covered topics were relevant. Keeping your survey short and focused will help you get more responses.
You can also look at dropoff rates alongside other metrics, like time-on-task, to get a better idea of where those weak points are.
Time-On-Task Shows You What Learners Find Most Engaging
Time-on-task is the time your employees spend actively digging into specific course content areas. This metric lets you know if they're actually participating or skimming through the material.
High time-on-task numbers suggest your learners are taking the time to digest and synthesize the information, which is a great sign your content is having an impact. Low time-on-task areas may signal that people are getting bored or distracted, or that the lesson needs to be simplified.
Analyzing time-on-task data reveals areas where you can improve engagement, but only if you look at accurate numbers. Since course complexity can skew your findings, look at your time-on-task data in combination with testing results.
One way to do this is by checking time-on-task metrics against your learners' scores and examining how many attempts it took to pass a quiz. This comparison will show you if learners spend more time in a particular section because of difficulty or disengagement. Once you've zeroed in on the right data, you can start to make adjustments.
Learner Feedback Helps You Improve Courses
Analyzing learner feedback lets you hear directly from your most valuable asset—your learners. Taking a bottom-up approach to identifying training needs gives your employees the opportunity to tell you exactly what they need to learn to perform better at work.
With 360Learning's powerful feedback features, you can better understand what is and isn't working and make necessary changes to improve the overall quality of your courses. This heightened awareness leads to happier, more engaged learners. And studies have shown that employees who feel like their learning needs are being met are 21% more engaged than their counterparts.
Enable Reactions For Quick And Easy Reviews
Reactions are an integrated feature of 360Learning that boosts engagement through real-time feedback. This enables your Learning and Development teams to roll out a course, have a specific group of learners review it in real time to identify improvements, and then relaunch it to more people for further feedback.
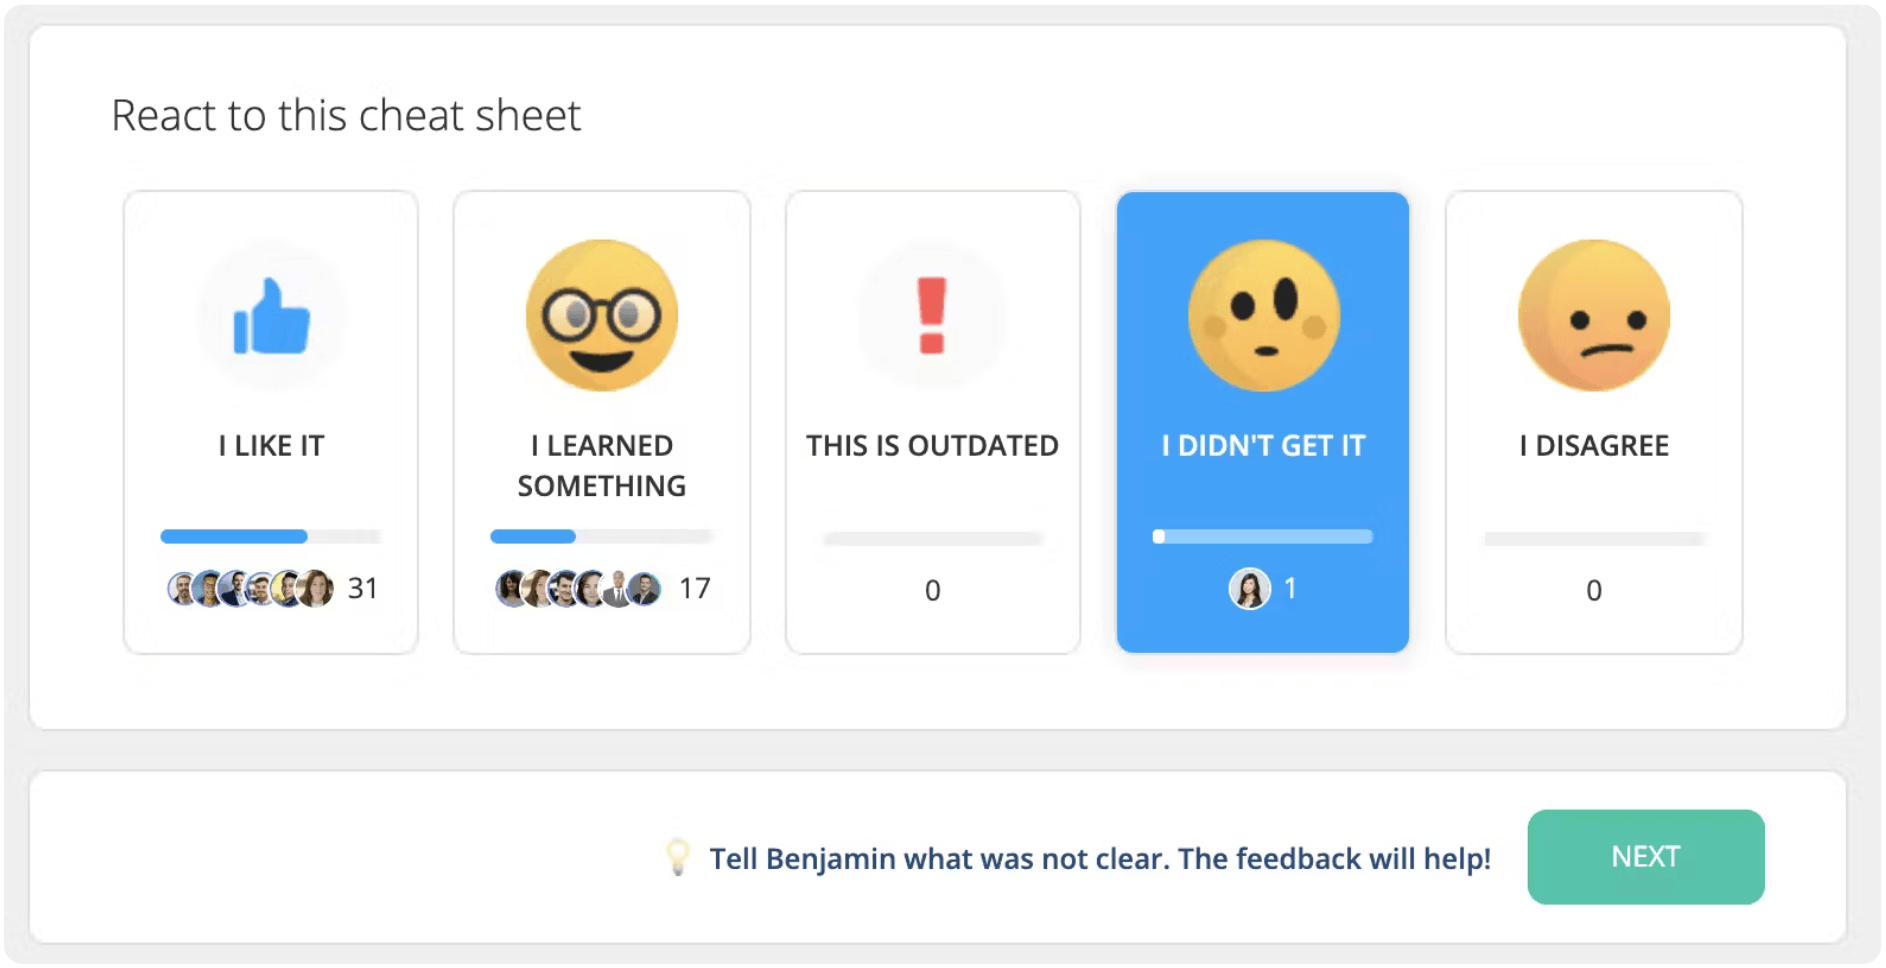
This feedback loop helps you release high-quality courses faster and increase your completion rates. Your learners become your beta testers, giving you a chance to spot any stale or incorrect information before it gets distributed to your entire company.
Relevance Scores Measure The Usefulness Of Your Courses
Gaining insights into the relevance of your training programs doesn't have to take a long time. 360Learning's Relevance Score feature empowers your teams to quickly assess the relevance of your courses at the moment of course completion. So you can make meaningful improvements almost immediately.
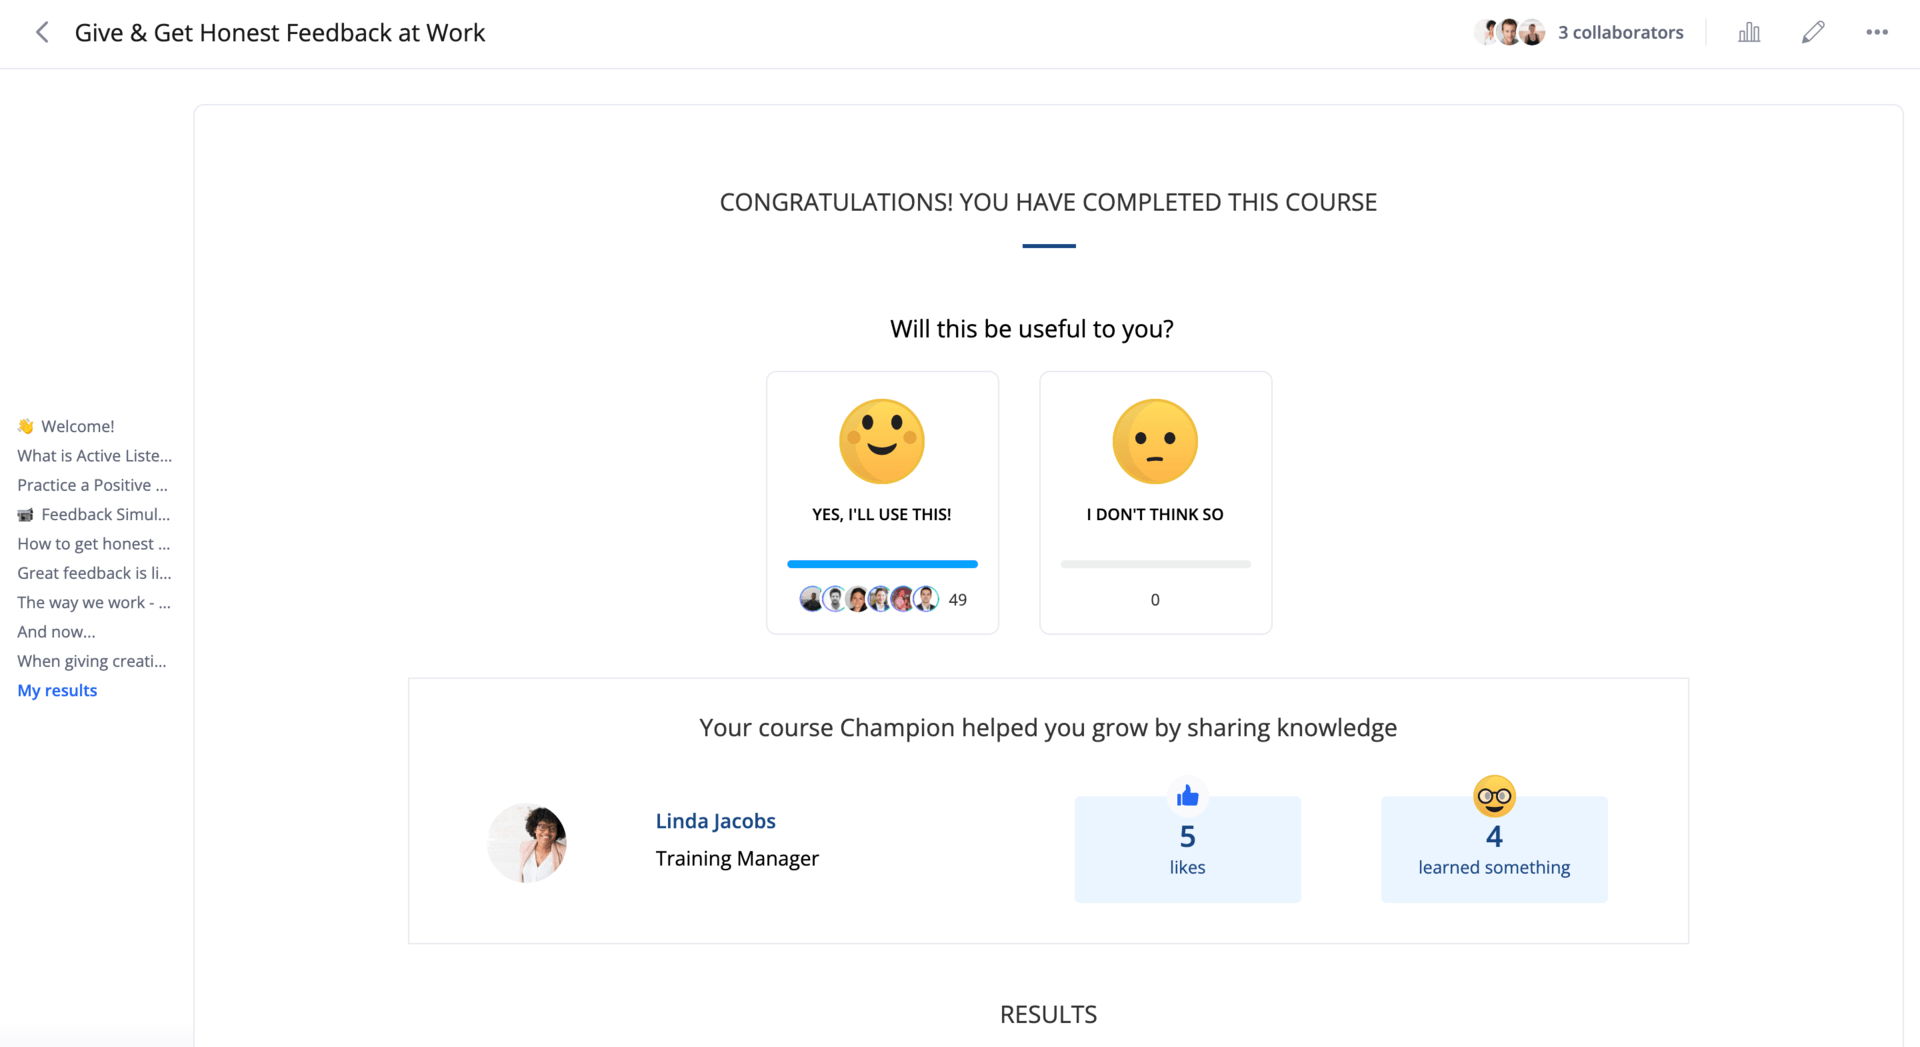
When learners complete a course, they are prompted to give feedback based on how helpful the course was for them. This option gives your learners an easy way to voice their thoughts with a single click, giving L&D teams a more accurate picture of learners' experiences. A low relevance score signals an opportunity to revisit your course materials to see what needs to be tweaked.
Unlock The Full Potential Of Your Learning Programs
360Learning's comprehensive LMS analytics and tracking features give you all the data you need to evaluate and optimize your learning programs. With real-time insights into learner progress, engagement, and satisfaction, you get all the data you need to make more informed decisions to deliver the best learning experience possible.
See how 360Learning can upskill your workforce at scale with a personalized demo here.
Read More:
- Go Beyond Learning Metrics: Our 6-Step Expert Playbook for Proving Your L&D Impact
- Did That Training Really Work? Measuring the Impact of L&D with Kevin M. Yates
- 7 Features to Look For in an Enterprise LMS Solution