

The Business Metrics Selection Framework
Level 4 of the Kirkpatrick model—Results—represents the ultimate measurement challenge: connecting learning activities to tangible business outcomes. But here's where traditional approaches often fall short. They treat Level 4 as a single, monolithic concept when, in reality, business impact measurement requires a nuanced understanding of which metrics matter for different types of training interventions.
Not all business metrics are created equal, and the wrong choice can derail your ROI measurement efforts before they begin. The key lies in identifying metrics that are:
- Directly influenced by the knowledge, skills, or behaviors your training addresses
- Measurable within a reasonable timeframe after training completion
- Significant enough to matter to business stakeholders
- Attributable to training with reasonable confidence
The challenge isn't finding business metrics—it's finding the right business metrics for your specific training program.

The Missing Link: From Learning Metrics To Bottom-Line Results
The L&D Professional's Business Metrics Cheat Sheet
Sales Training Programs: Beyond "Increased Sales Revenue"
While revenue is the obvious metric, smart L&D professionals dig deeper to understand the mechanisms driving that revenue:
- Revenue per sales representative (monthly or quarterly averages)
- Average deal size (particularly important for B2B sales training)
- Sales cycle length (time from lead to closed deal)
- Win rate percentage (deals won vs. deals pursued)
- Pipeline velocity (how quickly opportunities move through stages)
- Customer retention rate (for relationship-focused sales training)
- Upsell/cross-sell success rate (for account management training)
Real-World Application: A software company's sales methodology training showed modest revenue increases initially, but the real impact emerged in reduced sales cycle length—from 180 days to 135 days average. This 25% improvement in velocity translated to millions in accelerated cash flow, far exceeding the training investment.
Onboarding And New Hire Programs: Beyond "Employee Satisfaction Scores"
Effective onboarding impacts multiple business areas, each with measurable outcomes:
- Time to productivity (days until new hire reaches 80% of expected performance)
- 90-day turnover rate (percentage of new hires leaving within first quarter)
- 180-day turnover rate (capturing longer-term retention impact)
- Manager satisfaction ratings with new hire performance
- New hire engagement scores at 30, 60, and 90 days
- Training completion rates for role-specific competencies
- Customer interaction quality scores (for customer-facing roles)
- Error rates during the initial performance period
Case Study Spotlight: A healthcare organization revamped their nursing onboarding program with immersive simulation training. Traditional metrics showed high completion rates and positive feedback. But the business metrics told the real story: 90-day turnover dropped from 23% to 12%, and time to independent practice decreased from 16 weeks to 11 weeks. Given that each nursing departure costs the organization approximately $75,000 in recruitment, training, and lost productivity, the financial impact was substantial.
Compliance And Safety Training: Beyond "Completion Certificates"
Compliance training's business impact often appears in risk mitigation and cost avoidance:
- Safety incident reduction (frequency and severity)
- Workers' compensation claims (number and cost)
- Insurance premium changes (often lagging indicator)
- Regulatory fines and penalties (compliance training)
- Audit findings and corrective actions (quality compliance)
- Lost time injury rates (safety training)
- Near-miss reporting frequency (indicating safety culture improvement)
- Equipment damage costs (operational safety training)
Attribution Challenge: A manufacturing facility invested heavily in safety training following several incidents. Over 18 months, they saw a 40% reduction in reportable injuries and a 60% decrease in workers' compensation costs. However, they also implemented new safety equipment and revised procedures. Through careful analysis comparing similar facilities and controlling for other variables, they attributed 65% of the improvement to enhanced training, representing $1.2M in avoided costs.
Leadership Development Programs: Beyond "Leadership Assessment Scores"
Leadership training's impact ripples through team performance and organizational culture:
- Employee engagement scores for participants' direct reports
- Team turnover rates before and after leader participation
- Promotion rates of program participants
- 360-degree feedback improvement scores
- Team performance metrics specific to each leader's area
- Succession readiness ratings for key positions
- Cross-functional collaboration scores (for senior leadership programs)
- Decision-making speed and quality metrics
Customer Service Training: Beyond "Customer Satisfaction Scores"
While customer satisfaction matters, business impact extends to operational and financial metrics:
- First-call resolution rates
- Average handle time (balanced with quality measures)
- Customer retention rates by service representative
- Net Promoter Score (NPS) improvements
- Escalation rates to supervisors or managers
- Cross-selling/upselling success during service interactions
- Customer complaint resolution time
- Cost per service interaction
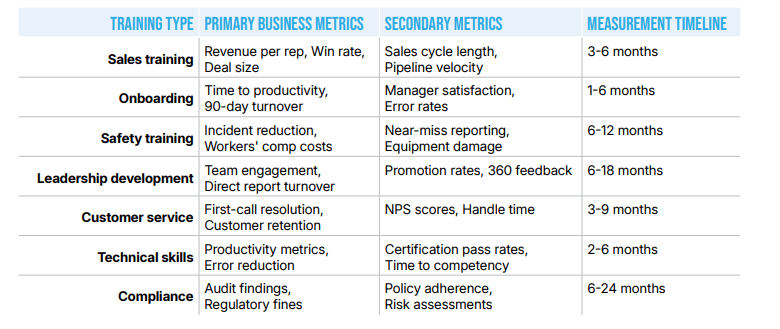
The Business Metrics Selection Matrix
To help L&D professionals navigate the complex landscape of business metrics selection, we've developed a practical reference matrix. This framework consolidates the most impactful metrics for common training types, along with realistic measurement timelines that account for when business results typically become visible.
Use this matrix as your starting point for measurement planning, but remember that every organization's context is unique. The specific metrics you choose should align with your company's strategic priorities and the particular business challenges your training is designed to address.
Establishing Baselines And Control Groups
The most sophisticated business metrics become meaningless without proper baseline measurement. Before launching any training program, establish:
Historical Baselines: At least 6-12 months of pre-training performance data for your chosen metrics. Account for seasonal variations and business cycles that might skew results.
Control Groups: When possible, identify comparable groups who won't receive training initially. This allows for true comparison and stronger attribution claims.
Environmental Factors: Document other initiatives, market conditions, or organizational changes that might influence your chosen metrics during the measurement period.
Healthcare Case Study: Surgical Safety Training
A regional medical center implemented comprehensive surgical safety training following several adverse events. Rather than measuring only training completion and satisfaction, they focused on business-critical metrics:
Learning Metrics:
- 98% completion rate for required modules
- Average assessment score of 92%
- High satisfaction ratings (4.6/5.0)
Business Metrics:
- Surgical site infections: Reduced from 3.2% to 1.8% over 12 months
- Malpractice claims: Decreased from 12 to 4 annually
- Average length of stay: Reduced by 0.3 days for major procedures
- Patient satisfaction scores: Improved from 87th to 94th percentile
- Insurance premium reduction: 8% decrease in malpractice coverage costs
The Bottom Line: The training program cost $180,000 to develop and deliver. The business impact included $2.1M in avoided malpractice costs, $890,000 in reduced length-of-stay expenses, and $156,000 in insurance savings. The ROI calculation: 1,748% return on investment.
Attribution Methodology: The medical center used a combination of approaches to establish attribution: they compared their results to similar-sized hospitals in their network, analyzed trends before and after training implementation, and controlled for other patient safety initiatives implemented during the same period.
Common Pitfalls In Business Metrics Selection
The correlation trap: Just because a metric improved after training doesn't mean training caused the improvement. Strong attribution requires careful analysis of contributing factors.
The timeline mismatch: Some business metrics take longer to appear than others. Safety improvements might show within months, while leadership development impact can take years to fully manifest.
The single metric mistake: Relying on one business metric creates vulnerability. Smart L&D professionals track 3-5 complementary metrics that tell a complete story.
The attribution anxiety: Perfect attribution is often impossible, but that shouldn't prevent measurement. Use confidence intervals and acknowledge assumptions in your reporting.
Moving beyond traditional learning metrics to meaningful business measurement transforms L&D from a cost center into a strategic business partner. The key lies not just in tracking business metrics, but in selecting the right metrics that tell a compelling story of training's true organizational impact.
In our eBook, The Missing Link: From Learning Metrics To Bottom-Line Results, we explore the sophisticated challenge of attribution—how to confidently claim that your training programs, among all the variables affecting business performance, deserve credit for the improvements you're measuring.