The Learning Analytics Journey: How To Chart Your Course
Where are you in your learning analytics journey? The way we measure learning impact—or, more often, don’t—is a long-standing source of debate in L&D, and too often it becomes a circular argument. A plethora of evaluation models tell us that we ought to do A, B, C, & D, but the constraints of time and budget mean that we don’t even get to A. And so it continues. Every year a new model. Every year a renewed cry for us to evaluate more rigorously. Followed by a lack of significant change. It’s like an endless loop we seem to navigate without ever finding an exit.
Meanwhile, the world has moved on. Data is ubiquitous and often instantly available, the fuel for artificial intelligence powering the next wave of automation in business and life. Data might be on everybody’s hot list of L&D concerns right now, but, when you look at the role it is actually playing in helping people learn, you see a lot more aspiration than practice. In fact, the current state of learning analytics in the organizational context can look a bit stuck.
Plotting Your Learning Analytics Journey
Part of the “stuckness” that afflicts many learning professionals is the inability to see a path between where they currently are on learning data and where they might need to be. Fear of the unknown. There again, they might have carried out quite a bit of useful work in data analytics but have no way of putting their progress in the context of learning data analytics as a knowledge field and seeing where they might need to go next to develop their practice.
It is to help with these issues that Learning Pool has developed its free Learning Analytics Maturity Model (LAMM) tool. At the heart of this is a simple diagnostic that can be taken in about 10 minutes to identify where the participant is on their learning analytics journey. The output is a free report that will benchmark them against their peers and provide an actionable roadmap for future learning data strategy.
The approach has been used by more than 100 organizations, proving useful as part of L&D strategy formulation and helping to make the business case for more investment in data within the learning department. It is now generally available to everyone, free of charge, with no obligation.

LAMM: The Rationale
The Maturity Model is based on a data schema advanced by learning expert Donald Clark in his book ‘Artificial Intelligence for Learning’. As we mentioned, the schema has four levels, which set goals we can summarize as below:
Describe
What does the learning data tell us about what things are happening?
Analyze
What does the learning data tell us about why things are happening?
Predict
What does the learning data tell us is likely to happen?
Prescribe
What does the learning data tell us that should happen?
To this list has been added a fifth, Starting Out. While not a goal in itself, there is a certain aspirational quality to being at the “starting-out” end of the scale, and this is a good place to consider why you want to use learning analytics.
The requirements and complexity of what is trying to be achieved accelerate significantly as you go up through the schema. Those companies whose goal is to prescribe actions and interventions based on data are at the very top end of what can currently be achieved.
The Importance Of Goals In The Learning Analytics Journey
The LAMM does not just look at technology, it is also about goals and about the people and capabilities that participants have around them in their organizations, both as potential sources of help and as stakeholders with needs to be met through learning data. For example, if you have talented people who are data-savvy but technology poor, you are in a different position from someone with no capabilities in the team at all.
Goals are of fundamental importance to the model. Those who aspire to recommend learning experiences based on data, for instance, will need to look seriously across each aspect of the diagnostic and consider how to start a path forward, whereas if they just need to know more about what is happening with the learning they already provide, the end goal could be closer than they think.
The output of the model then ends up looking more like a matrix, showing maturity across areas of:
- Strategic Buy-in
- People & Capabilities
- Market Best Practices
- Technology & Processes

LAMM: Initial Findings
One of the great benefits of a benchmarking tool like the LAMM is to see where your organization sits in relation to other organizations. In first results from the many learning professionals who have used the LAMM we’ve seen that the average placement for an organization on the Maturity Model is just a little above level 2: Describe – 2.1, to be precise.

But, overwhelmingly, most organizations are actually stuck at level 1: Starting Out. A few trendsetters are skewing the mean average result higher than the mode.
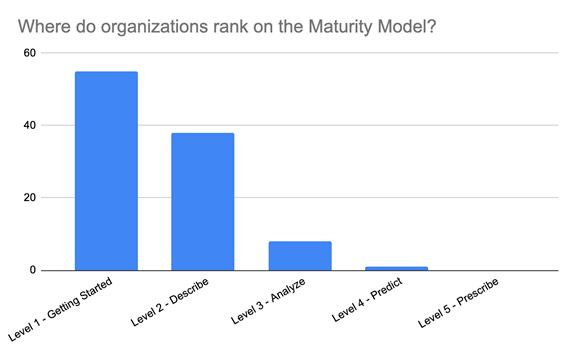
So far we see little difference between different industries, geographies, or even business size, although larger organizations do tend to perform better than smaller (2.2 vs 1.9). Things start to get more interesting when we dive behind the Overall position score and look at where organizations rank themselves in terms of Strategy, People, Market Awareness, and Technology.
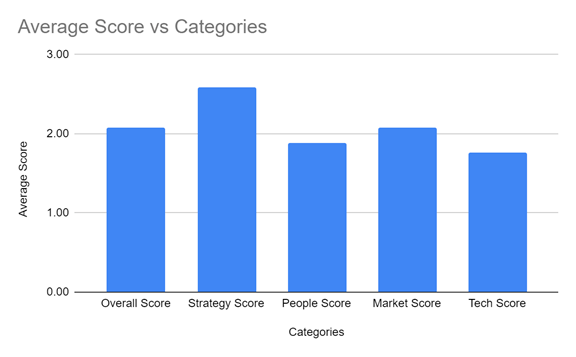
Here, for the first time, we see evidence of what others have reported elsewhere; we are really quite deficient when it comes to the skills it takes to successfully deploy a data-driven learning approach. While the Strategy score is high (i.e. the leadership says data is important), the People and Technology scores are low (i.e. leaders aren’t really investing despite the vision). Digging deeper into the technology, we see that 75% of all organizations surveyed suggest that their technology is holding them back from collecting all data they would like to use in assessing their learning interventions.
Conclusion
The most compelling indicator of an organization that is further along the Maturity Model turns out not to be its leadership or its vision and commitment to People Analytics but its customers. If internal (or external) customers are demanding data, then we see organizations moved to deliver it. Statistically, this relationship appears to be clear; the higher you answer the question “How important is Learning Analytics to your Customers” the higher your overall position on the Maturity Model is likely to be.
Of course, you could wait for a savvy customer to come along … or you could see this as a challenge to take on now. The first job of any L&D specialist looking to make the case for data is to get your customers asking for it and not your leadership. Who those customers are, be they internal in another part of the company or external, doesn’t seem to matter. The customer is always right.
Download the eBook Data And Learning: Adding Learning Analytics To Your Organization to leverage the power of Big Data for your business. You can also join the webinar for more insider tips to map out your learning analytics journey.
LAMM References:
See where you are on your learning analytics journey. Benchmark your organization with the LAMM.


